Table of Contents
Feedback Stream
Overview
Feedback Stream is an actionable, real-time tool where you can view survey performance and obtain details of the feedback you’ve received.
You can view the most relevant aggregated data, such as Key Performance Indicator (KPI) scores and survey volume, at the top of the page. Additional details on each response are available and can be filtered to get the most relevant results. Details include interaction details, the associated Agent, or other answered survey questions.
Time Selection
The Feedback Stream supports flexible time and time zone selection to help users view data accurately across regions.
By default, the dashboard uses the time zone detected from the user's browser. You can change this at any time by clicking the time zone selector and searching for or selecting a different time zone from the list. The selected time zone will be applied consistently across all displayed metrics and timestamps.
You can also define the reporting time period using the date range selector. Select a start and end date to control the time window for the data shown in the Feedback Stream.
Summary Strip
With Summary Strip’s aggregated metrics — which you can find at the top — you can quickly assess survey health through KPI scores and trends compared to the last time period selected in your filters.
Summary Strip also respects any filters applied, so you can use certain filters like CSAT scores to assess volume, or apply specific Agent filters to view aggregated KPIs by individual or group of individuals.
Note: Certain configurations that are available when setting up surveys in Flow Builder will allow for reporting through Summary Strip and other Feedback analysis tools.
CSAT Score Card
The “CSAT score” card collects data through all surveys and reports the average rating of CSAT questions on a 1-5 scale. This card is calculated by the average score from CSAT questions designated as KPIs in the Flow Builder, or template surveys that contain only one CSAT question.
NPS℠ Card
The Net Promoter Score℠ is calculated by subtracting the percentage of Detractors from the percentage of Promoters when assigning the KPI designation to NPS questions.
Response Rate Card
The “Response rate” card indicates (in percentage) the proportion of responded surveys from the pool of sent surveys.
Sent Surveys Card
The “Sent surveys” card displays the number of post-interaction surveys that have been successfully delivered to contact persons.
Responses Card
The “Responses” card indicates the number of surveys collected from respondents with one or more answered questions.
Notes:
- All surveys sent and received, and their associated raw response data, are available through the Feedback Flow Report.
- Feedback Stream intends to show data that can be further acted on. Because of this, there may be a difference in the number of surveys sent and received between Feedback Stream and Feedback Flow Report, because the raw data will contain surveys that were suppressed or opt-outs.
- Summary Strip cards consider all response data, but the list of responses in the Feedback Stream shows only what your respondents have submitted. System-generated suppression and opt-outs can be accessed from the Feedback Flow Report.
Response Details
From the main list of responses on Feedback Stream, key details of each individual response will be available, such as KPI scores, timestamp, Agent, survey channel, and more.
You can then dive deeper into the metadata and context for each response. When you open the response panel, you can see all available information for each response.
On the response panel, the following items are visible:
- All answers to the survey questions.
- Metadata associated with the interaction that happened before the survey.
- An audio player with the call audio to gain a more profound understanding as to why a respondent may have answered the survey the way they did.
Filters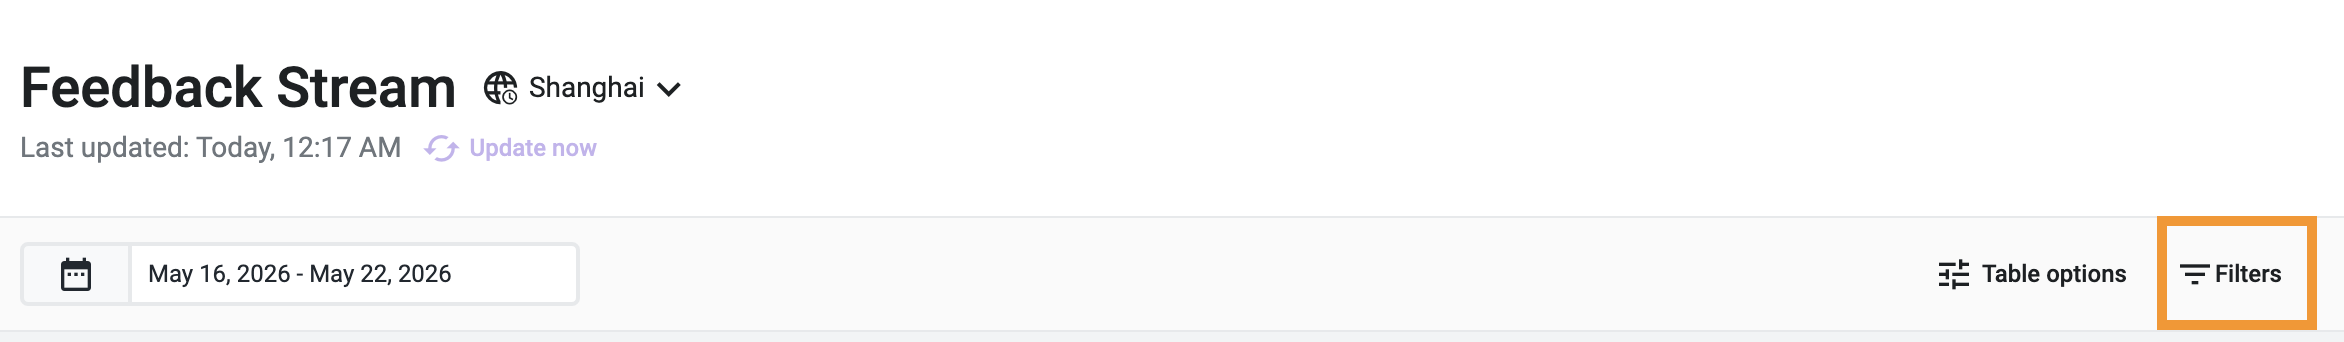
To access the filters, enter Feedback Stream and click the Filter icon at the top right of the page. Filters allow you to get a list of responses by date and several fields that relate to the survey data and interaction metadata collected in the response submission.
Note: Summary Strip obeys all filters.
Below is the list of available filters and their purpose:
| Filter name | Purpose |
| “Date range” | Responses within a given period of time. |
| “CSAT Rating” | Responses with selected Customer Satisfaction (CSAT) ratings (from 1 to 5). |
| “NPS® Rating” | Responses with Detractors (score 0-6), Passives (score 7-8), or Promoters (score 9-10). |
| “Survey flow” | Name of the survey flow. |
| “Interaction ID” | Responses for a specific interaction or interactions. |
| “Agent” | Responses related to a specific Agent or group of Agents. |
| “Ring groups” | Ring groups of the survey interaction. |
| Teams | Teams of the survey interaction. |
| “Survey channel” | Responses for a specific survey channel, SMS, IVR, Chat, or both. |
| “Feedback type” | Responses with open feedback. |
| "Flow name" | Name of the survey flow. |
[Preview] Copilot for Feedback
Note: The Copilot for Feedback is currently in a preview phase. To explore these features and participate in our early-access program, please contact Talkdesk to enroll in the preview.
The Copilot for Feedback tool, accessible via the Ask Copilot icon within the Feedback Stream, leverages Large Language Models (LLMs) to transform raw customer sentiment into clear, actionable summaries. By opening the Copilot side panel, administrators can instantly categorize feedback into positive or negative trends across both Customer Service and Product categories.
Users can generate tailored reports by selecting from a suite of pre-built questions:
- Summarize the top positive customer service feedback.
- Summarize the top negative customer service feedback.
- Summarize the top positive product feedback.
- Summarize the top negative product feedback.
The system features a comprehensive time-period dropdown within the Ask AI input area. While the interface defaults to the Last 30 days, users can refine their analysis by selecting ranges from 1 complete day up to 6 complete months.
Once a question and timeframe are submitted, the system generates a dynamic Executive Summary. This report identifies recurring themes, provides the percentage of feedback mentions for each topic, and offers strategic recommendations for business improvement.
To dive deeper into specific insights, click Show details to expand the list of feedback entries associated with a particular topic. For a more granular view, selecting an individual feedback entry will trigger a side panel, allowing you to review the raw feedback details and original customer comments in full context.
Timezone
The Feedback Stream supports flexible time and time zone selection to help users view data accurately across regions.
By default, the dashboard uses the time zone detected from the user's browser. You can change this at any time by clicking the time zone selector and searching for or selecting a different time zone from the list. The selected time zone will be applied consistently across all displayed metrics and timestamps.
You can also define the reporting time period using the date range selector. Select a start and end date to control the time window for the data shown in the Feedback Stream.
Filters
The available filters are the following:
| Filter name | Purpose |
| “Date range” | Responses within a given period of time. |
| “CSAT Rating” | Responses with selected Customer Satisfaction (CSAT) ratings (from 1 to 5). |
| “NPS® Rating” | Responses with Detractors (score 0-6), Passives (score 7-8), or Promoters (score 9-10). |
| “Survey flow” | Name of the survey flow. |
| “Interaction ID” | Responses for a specific interaction or interactions. |
| “Agent” | Responses related to a specific Agent or group of Agents. |
| “Ring groups” | Ring groups of the survey interaction. |
| Teams | Teams of the survey interaction. |
| “Survey channel” | Responses for a specific survey channel, SMS, IVR, Chat, or both. |
| “Feedback type” | Responses with open feedback. |