If your Talkdesk account has multiple ring groups (i.e., "Sales", "Support", "IT", etc.), you will find it useful to view metrics for each ring group. If you have permission to use Dashboards and Reports in Explore, you’ll be able to apply filters and have a more meaningful approach to your Contact Center's performance.
For more information about Explore permissions, please check the article Explore Overview.
Filtering Dashboards
There are 3 main filtering areas in Dashboards - volume, agent and time.
Depending on the dashboard, you will see different filtering options.
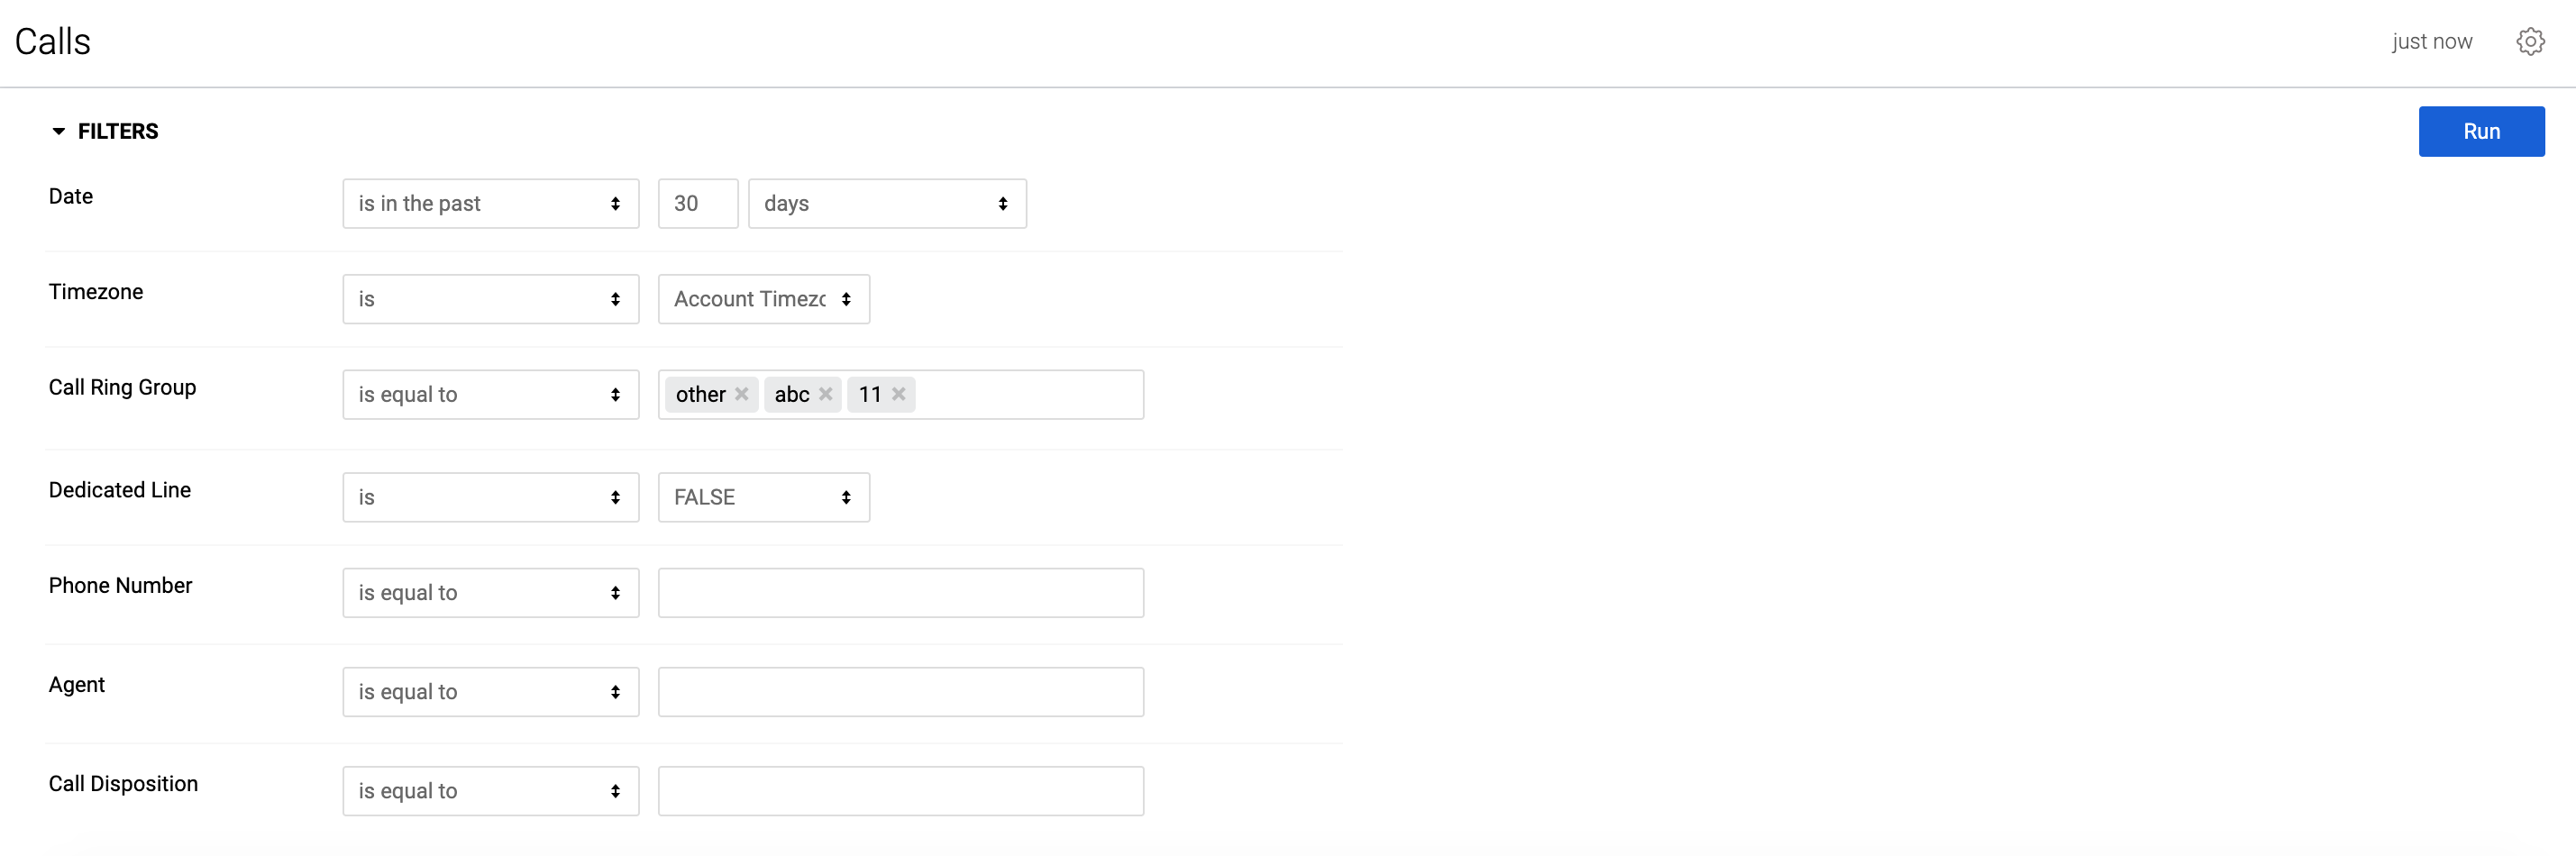
For volume, you have the Call Ring Group, the Numbers Ring Groups and the Phone Number filters to help you gain a better insight into the Ring Group (queue) level.
Call Ring Group - filters the data by ring groups of the calls.
Number Ring Group - filters the data by ring groups of the numbers.
Dedicated Line - allows you to separate the volumes of your contact center between calls to dedicated lines and calls to regular lines.
Phone Number - filters the data by Talkdesk Phone number. It is possible to filter by Talkdesk telephone number (DNIS) the following dashboards:
- Calls
- Dispositions
- Inbound
- Numbers
- Number Details
- Outbound
- Service Level
For agents, you have the Agents Ring Groups and Agent to help you to filter the information to better access at agent level information:
Agent Ring Group - filters the data by the ring groups allocated to the agent.
Agent - filters the data by agent name and agent email. You will see only the agents that belong to your ring groups.
For time, you have the Date and Data Aggregation filters:
Date - you can set a specific date, a time range, or use the before and after conditions (and other time rules) to return information for the timeframe you wish to analyze;
E.g.,1 in the past 1 day - this counts since 00:00 am of the day you’re in until the moment you click run (default reports) or click send. In case of a schedule it will count from 00:00 am until the moment you scheduled the job to be delivered.
E.g.,2 in the past 1 complete day - this is the equivalent to Yesterday. Since 00:00 am until 11:59 pm of the previous day.
Timezone - you can set the timezone in which you need to see the information;
Data Aggregation - it will allow you to arrange the distribution of your data by Minute, Hour, Day, Week or Month.
Timeframe limits:
- 7 days and onward will have the option to see the data with weekly, daily and hourly granularity.
- 30 days and onward will have the option to see the data with weekly and monthly granularity.
- 13 weeks and onward will have the option to see the data with weekly, monthly and quarterly granularity.
- Over 52 weeks will have the option to see the data with monthly and quarterly granularity.
- Default granularity when an unavailable granularity is selected:
- If a granularity lower than what’s permitted is selected, the default granularity applied will be the lowest possible.
- If a granularity higher than what’s permitted is selected, the default granularity applied will be the highest possible.
Click on Run to display the data for the selected filters.
Dashboards Persist Filters
When using Default Dashboards with the new “Persist filters” feature you have the option to apply the filters used in one dashboard to the remaining dashboards, so that they are equally configured (applies to common filters between dashboards). For example, when visiting the Inbound Calls Dashboard: you can pick “Persist Filters”, and when navigating to the Service Level dashboard the filters that are common between these two dashboards will be set with the values configured in the Inbound dashboard.
Notes:
- Does not work with reports, only dashboards.
- Does not work with custom dashboards.
Filtering Reports
Filtering data in a report is similar to what was previously described for dashboards filtering. The only difference is that the filtering section will have a grey background so that you can distinguish between reports and dashboards.
Report filtering can also be set for the moments where you need to schedule or send a report file to your email. This requires you to configure its sending and scheduling settings. You can achieve this by first clicking Settings (gear icon) on a report’s landing page, and afterwards by selecting Send… or Schedule… in the drop-down menu.
A new window will pop up, where you can apply the filters you wish for your report.
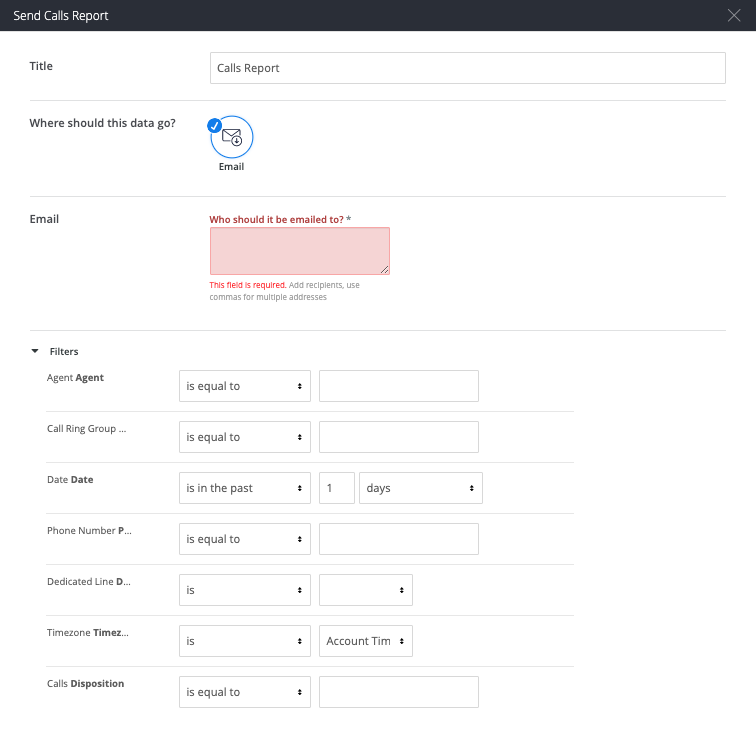
Below you can find a description of all filters that are available for reports. However, please bear in mind that each report has a specific set of filters, which you can check in our Default Reports article.
- Phone Number - Similar to when filtering by Ring Group, you might want to narrow your analysis to check the activity for one (or more) of your account's phone numbers.
- Date - Choose the desired time period for your analysis by clicking on the corresponding fields for Date.
- Timezone - By default, the report is using your account Timezone, but you can adjust this to a Timezone that better reflects your needs in the Timezone filter.
- Call Ring Group - By default the report displays all calls received by your company, but it might be useful for you to only see calls received on specific ring groups.
- Agent - Use this filter in case you want to narrow the scope of agents you’re looking at.
- Call Disposition - If you want to focus your attention on a specific Disposition, use this field to narrow your search.
- Agent Ring Group - This field is useful to see the activity of agents of specific ring groups.
- Interval - Select the desired interval for your analysis: 10 minutes, 30 minutes or 1 hour.
- Outbound Disposition - Filters the data by the outbound disposition codes you have configured in your account.
- Inbound Disposition - Filters the data by the inbound disposition codes you have configured in your account.
- Active Agent - Select whether or not the agents were active during the analysis period.
- Number Ring Group - By default, the report displays all your numbers, but it might be useful for you to only see the data of numbers that have specific ring groups.
Example: Filtering by Call Ring group and Agent Ring group
Imagine you have a support ring group and let’s say you use “support” in the filter Call ring group. You’ll see the results under the columns (Total Outbound Calls, Total Inbound Calls, Average Speed to Answer, and Average Talk Time) change, the number of calls will be lower - and you can even see some Agents with 0 calls. This is because we’re only looking at calls that had the support ring group.
But, if you filter by Agent Ring Group using support, you’ll see that some agents disappear from the list. This is because now the distribution only returns the agents with that ring group on their profile.
Note: In case of a call transfer, the call is considered from start to finish. The generated metrics are related to the last agent and ring group of the call, before the call gets disconnected.