When you open Talkdesk Guardian™, you’re redirected to the “Overview” page.

In there, you can check the following information:
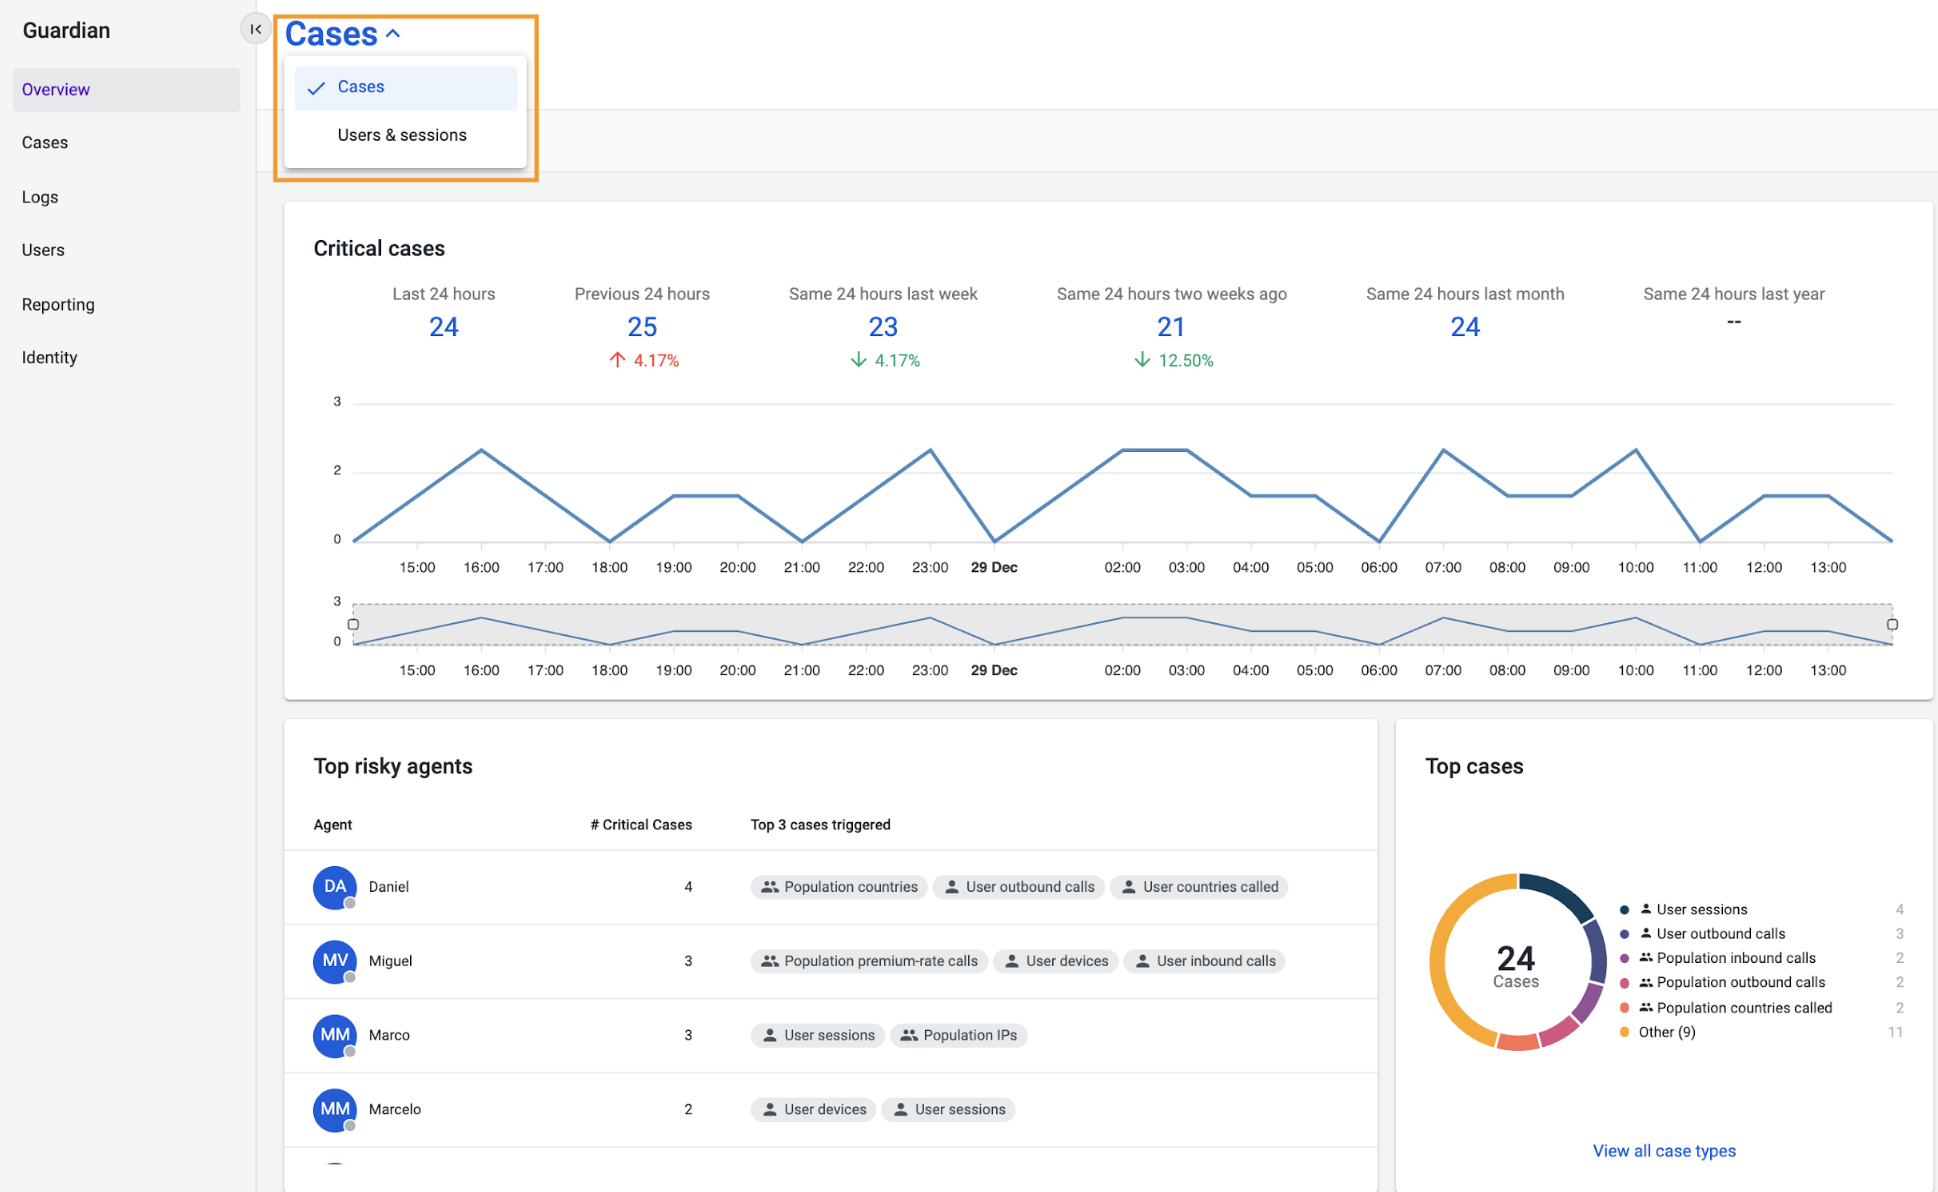
By default, the page shows an overview of Cases, but you can select the Users and sessions overview option on the drop-down menu.
Cases
In the Cases overview, you’ll see:
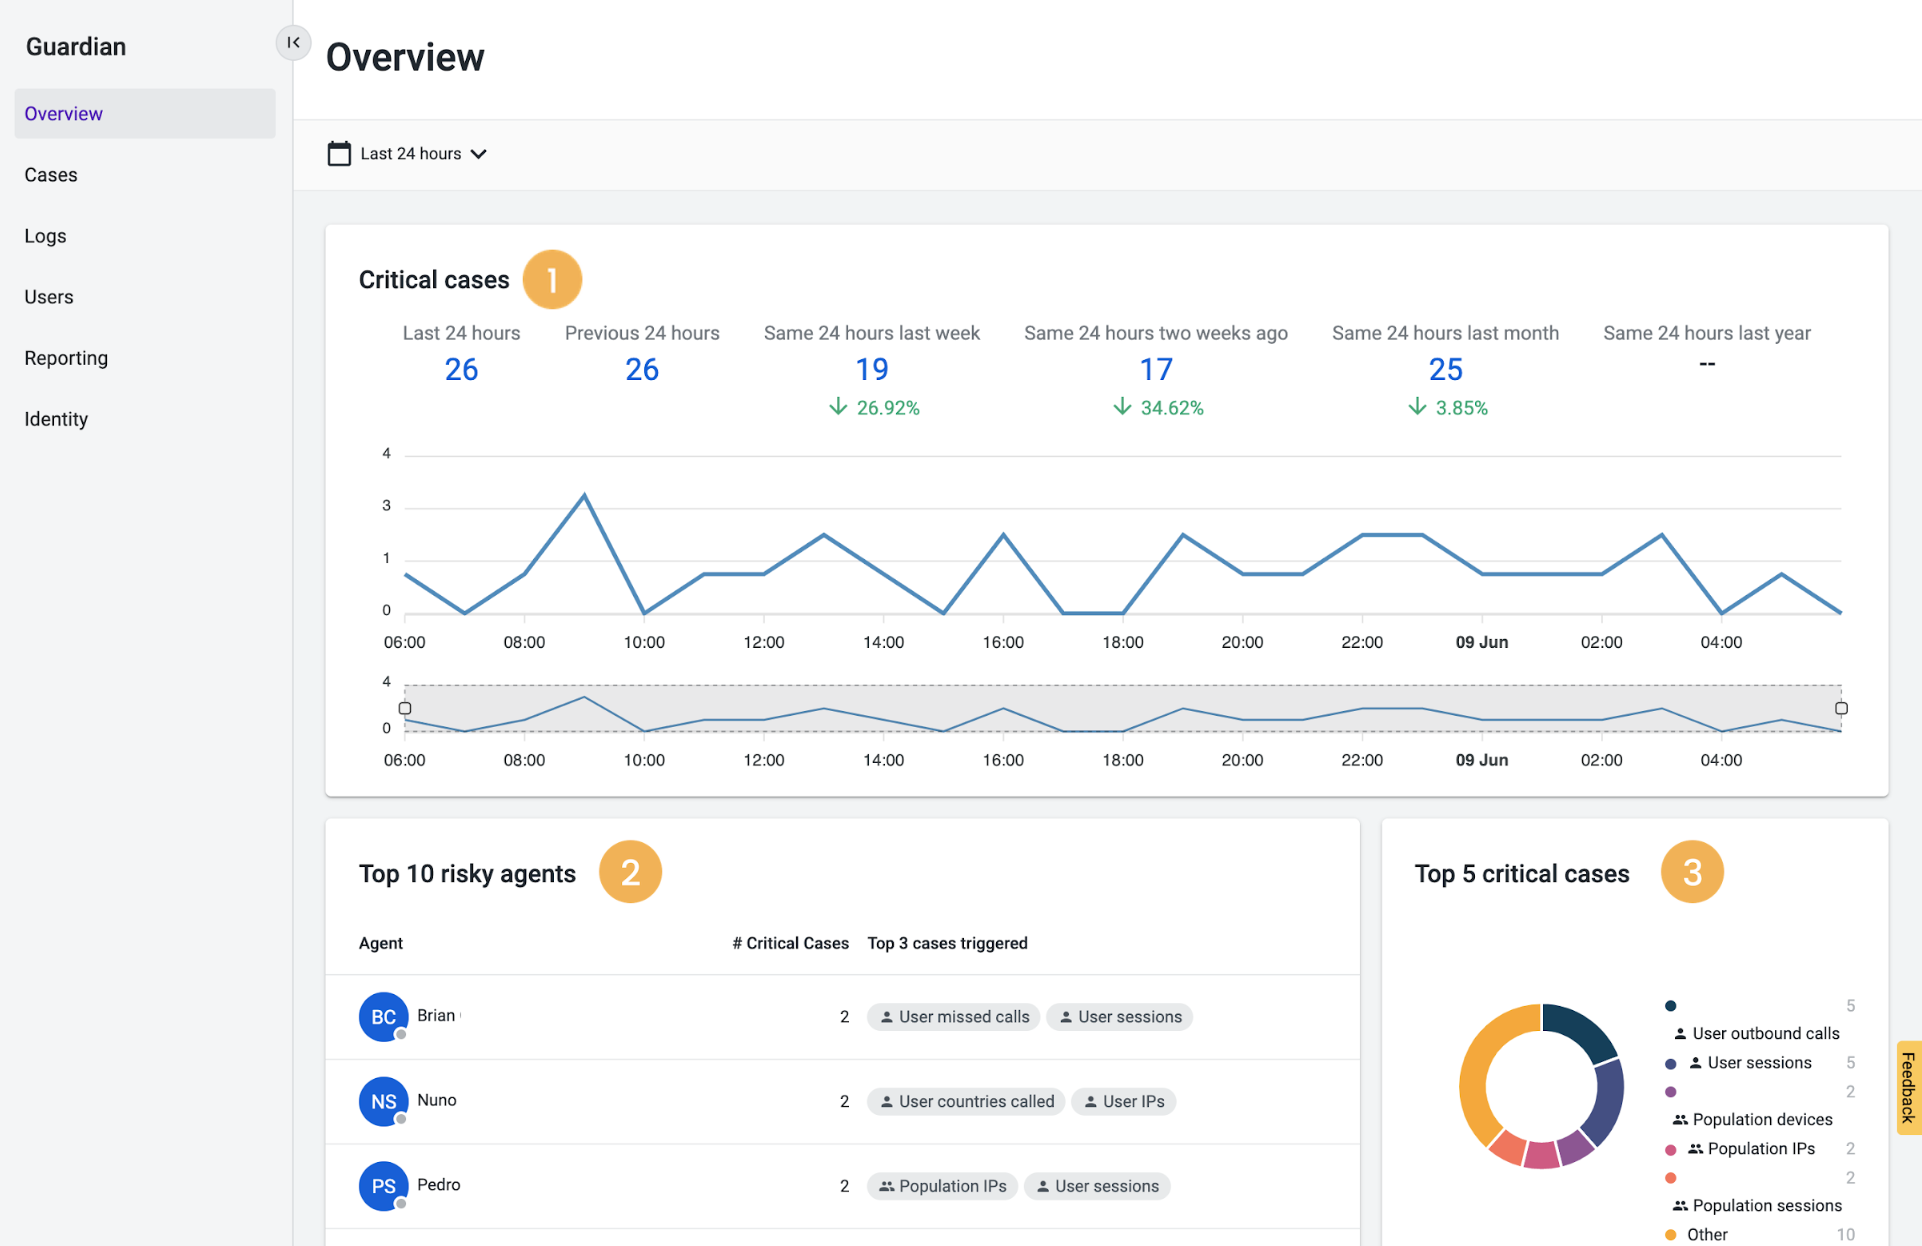
- Various insights and summaries on “Critical cases” [1].
- “Top risky agents” [2] information.
- “Top cases” [3] data.
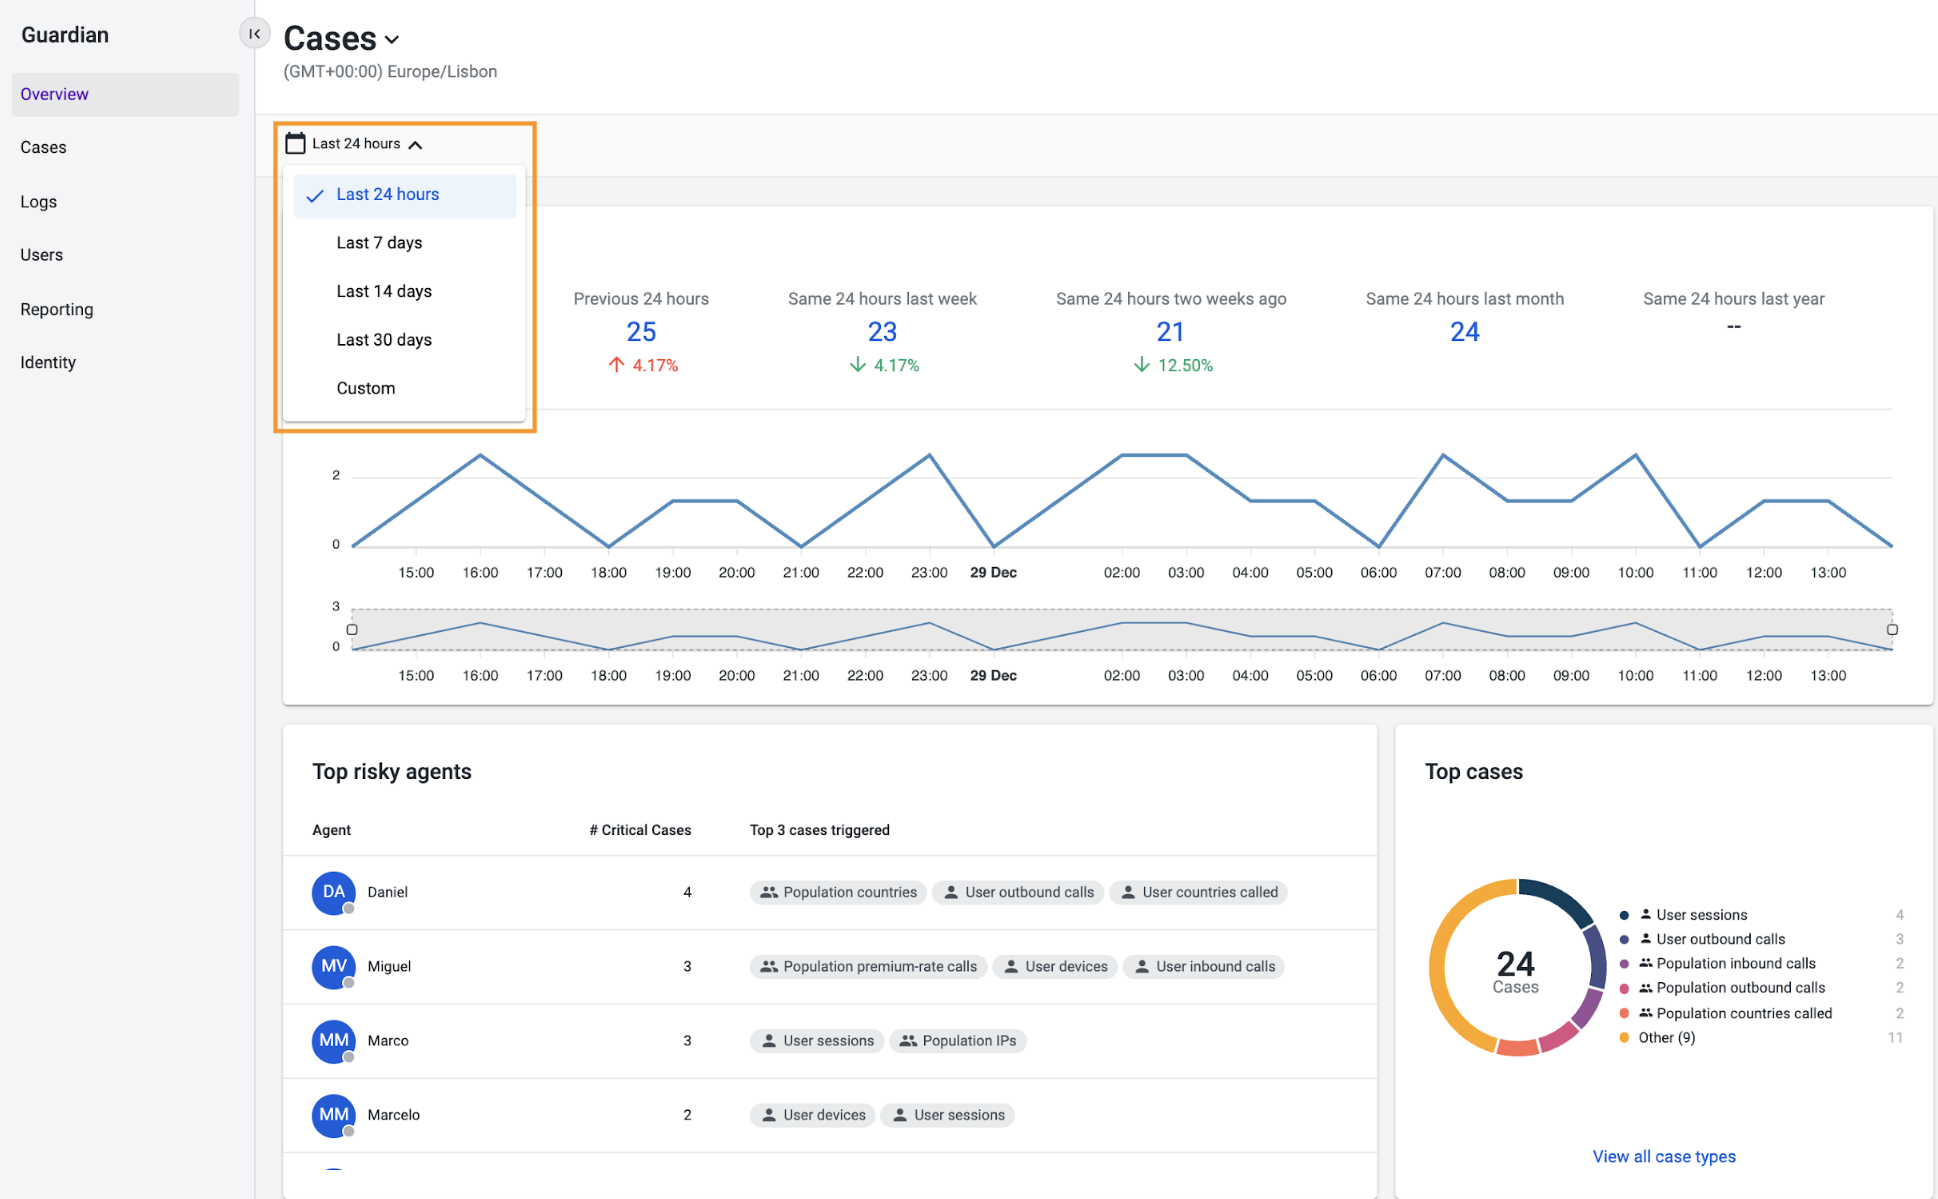
You can filter the information by time period.
Tip: By default, it’s set up for the “Last 24 hours”, but you can customize it and select a date up to one year back.
Critical cases
In this widget, you can access more detailed information by clicking on one of the time frames.
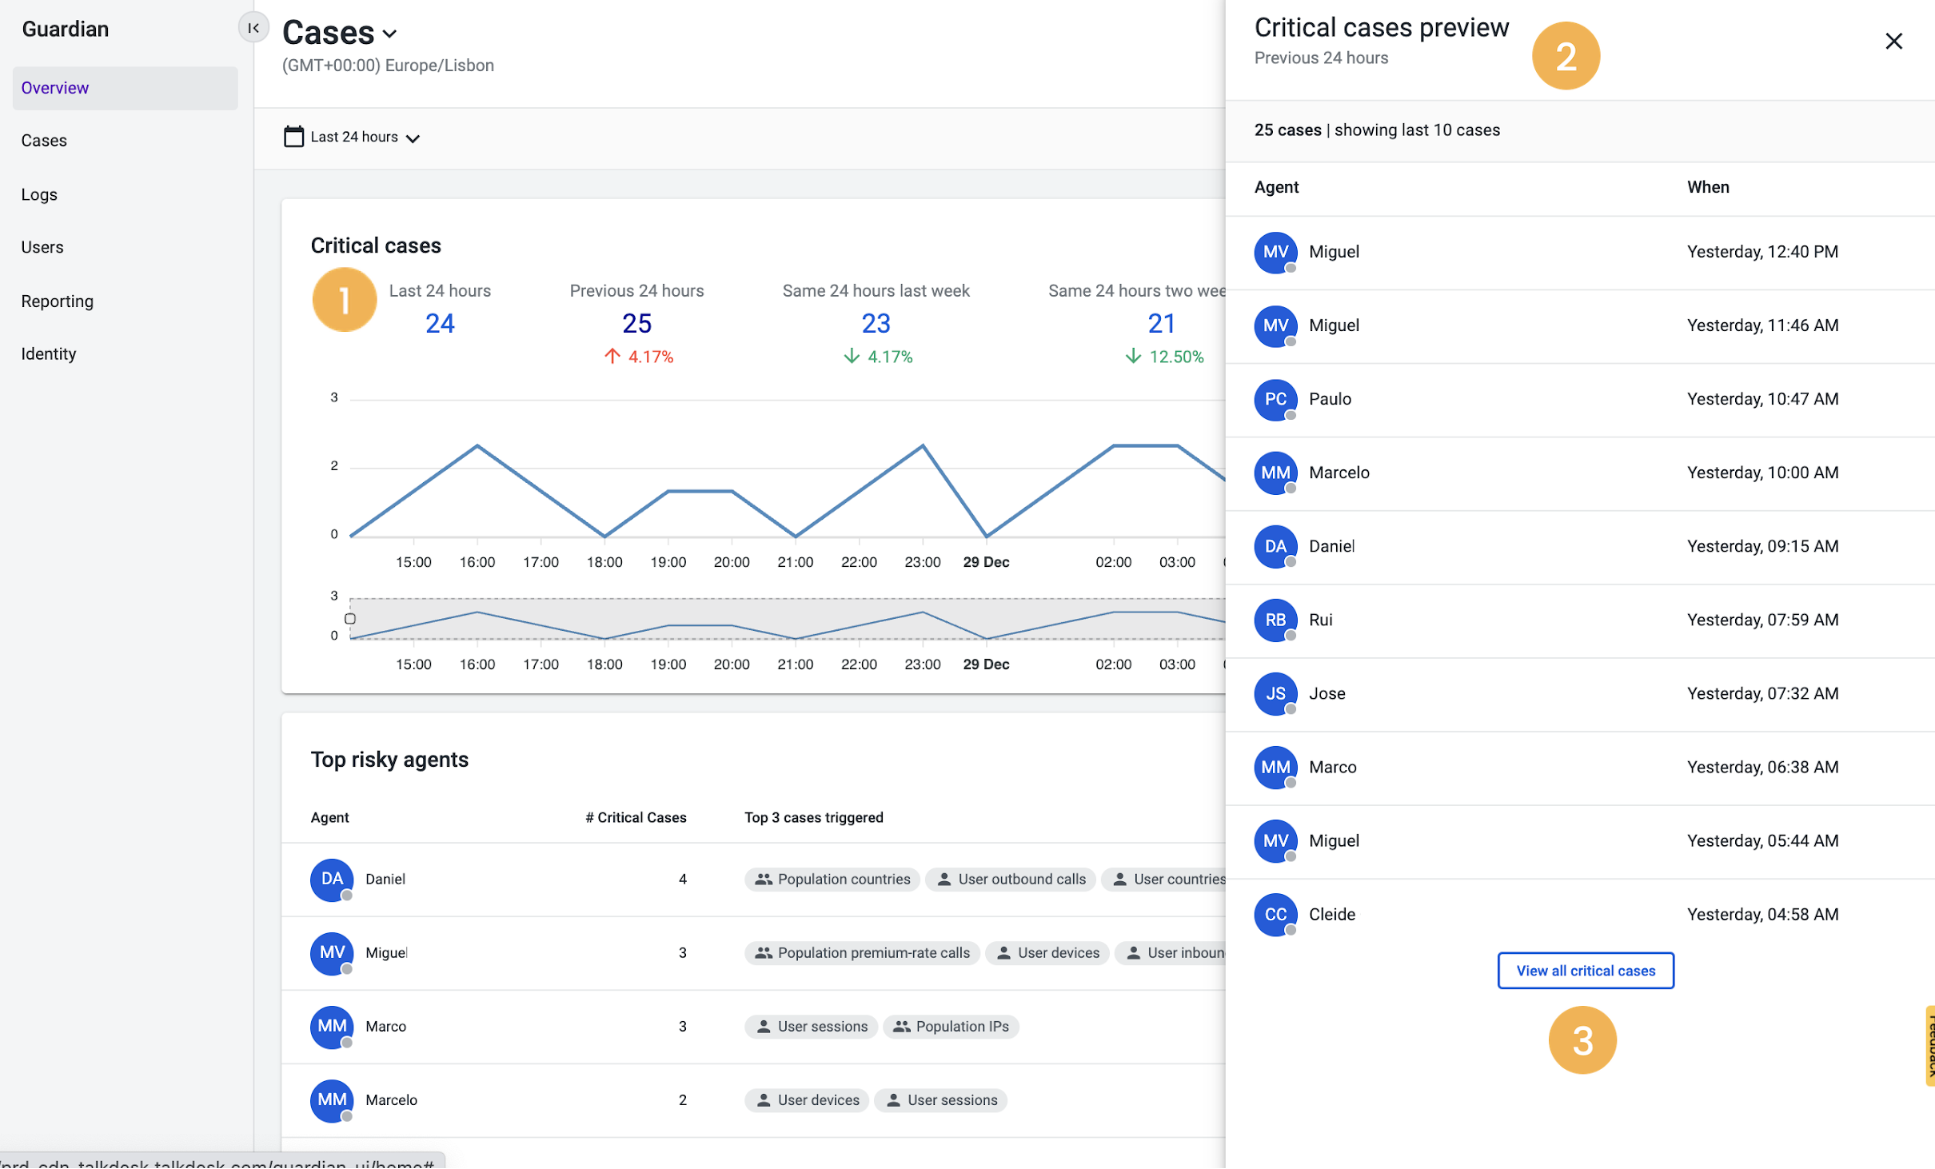
In this example, if you click on Last 24 hours [1], a pop-up window will appear on the right side with the “Critical cases preview” [2], and with the agents’ names. If you select View all critical cases [3], you will be instantly redirected to the Cases page.
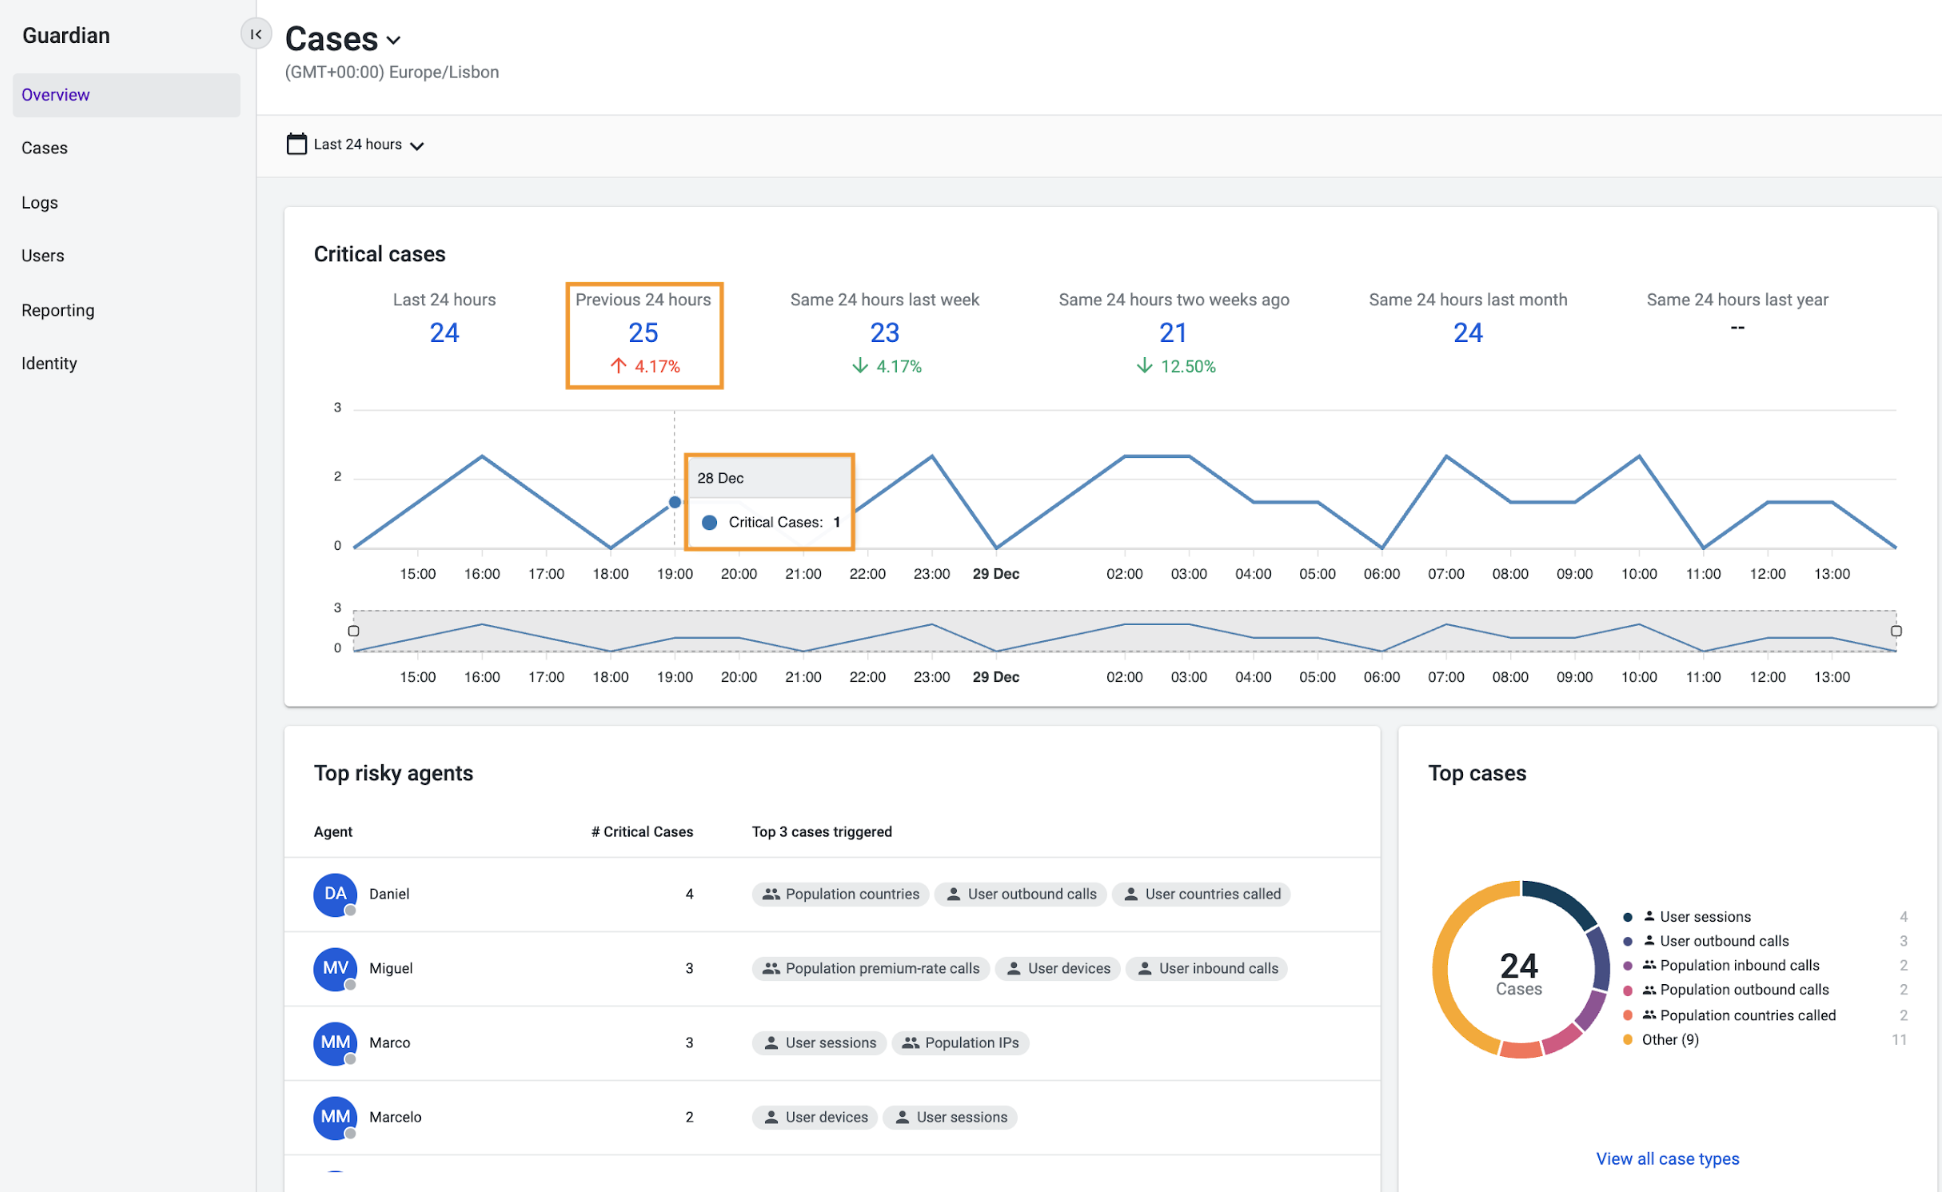
Under the number of detected cases, you will see the evolution of the selected filter in the previous 24 hours (the previous days, weeks, months, or years). In this example, the last 24h saw a 4.17% increase in critical cases. Besides this, if you hover the mouse over the graph, you can confirm the number of cases per day. If you click there, a new pop-up window will appear.
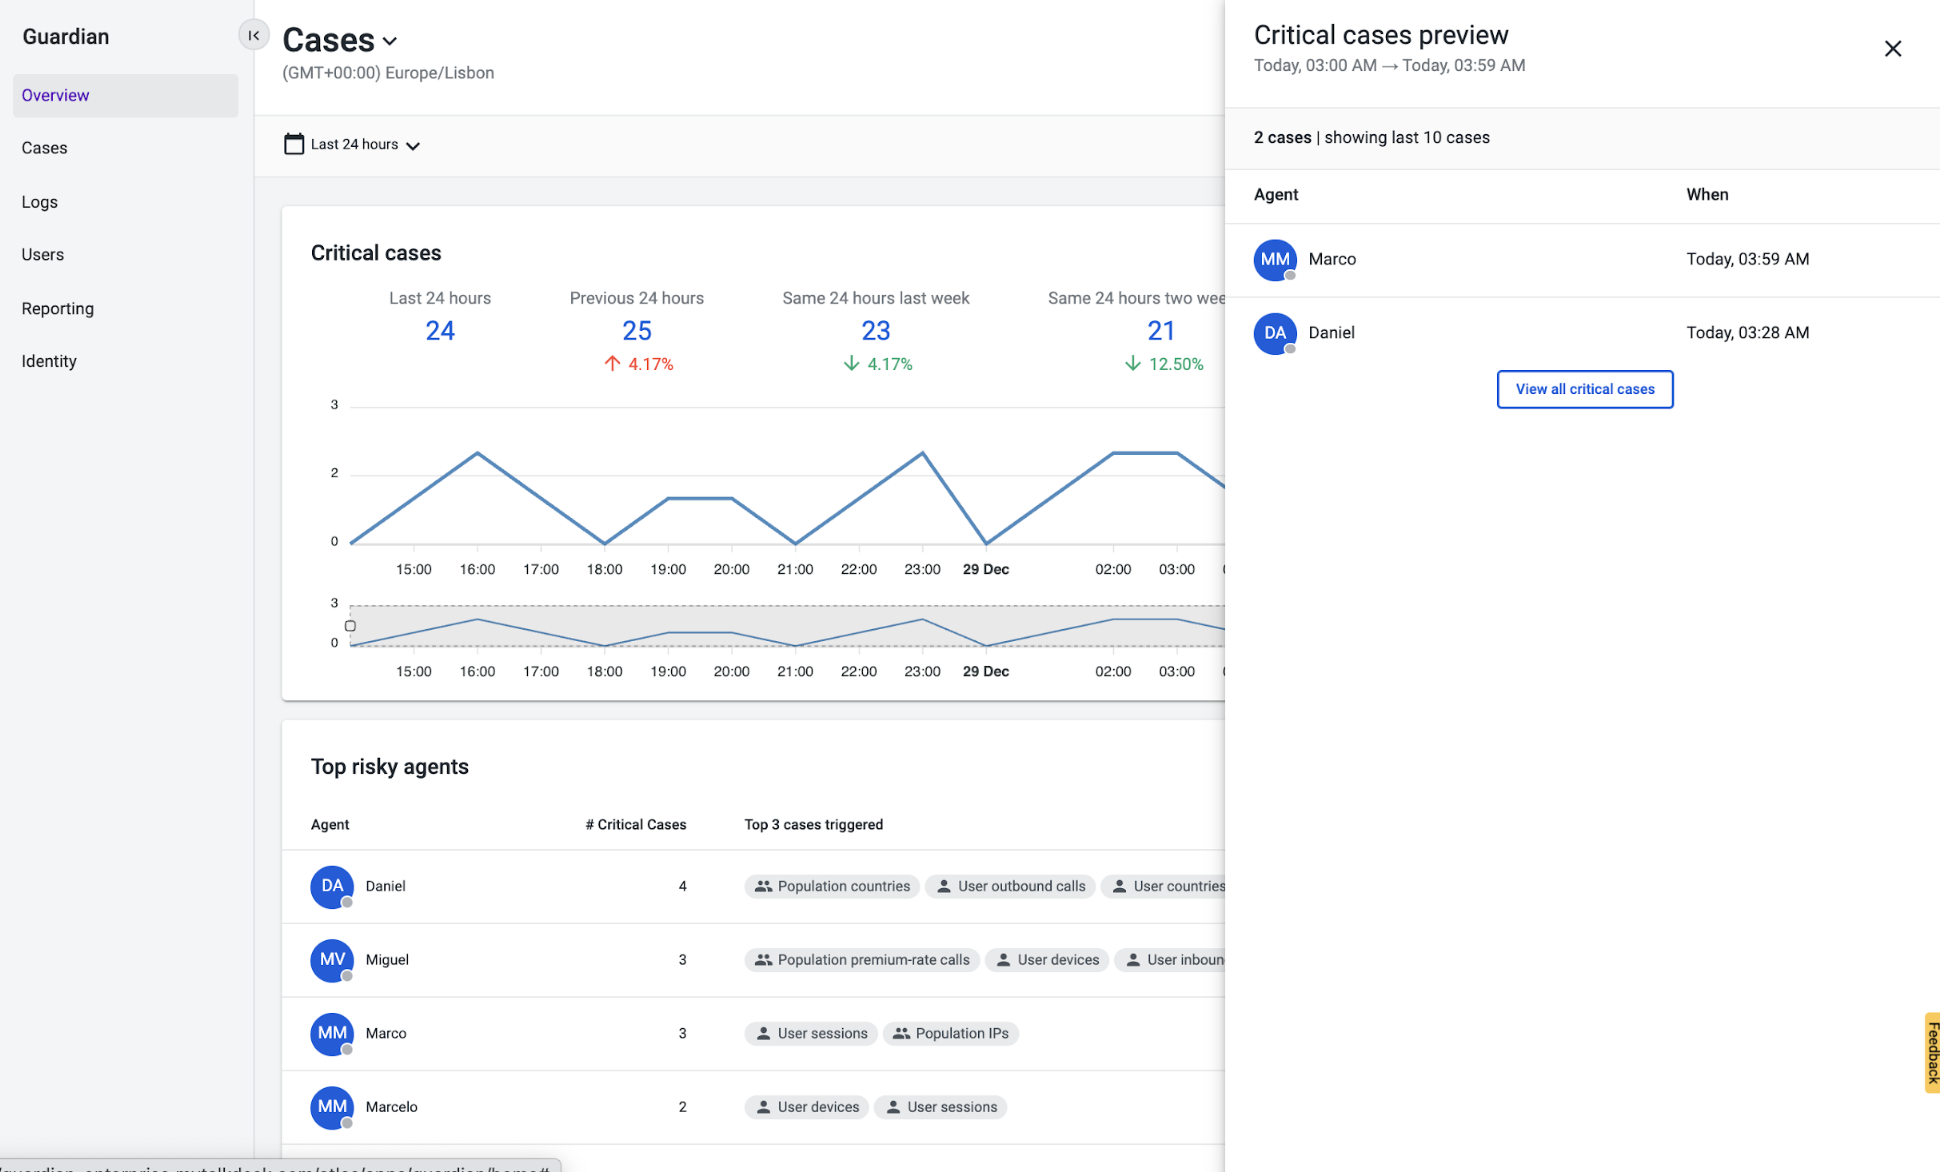
You can view the specific date and time of the occurrence, as well as the agents’ names. You can close the new window by clicking on the “X” icon in the top right corner.
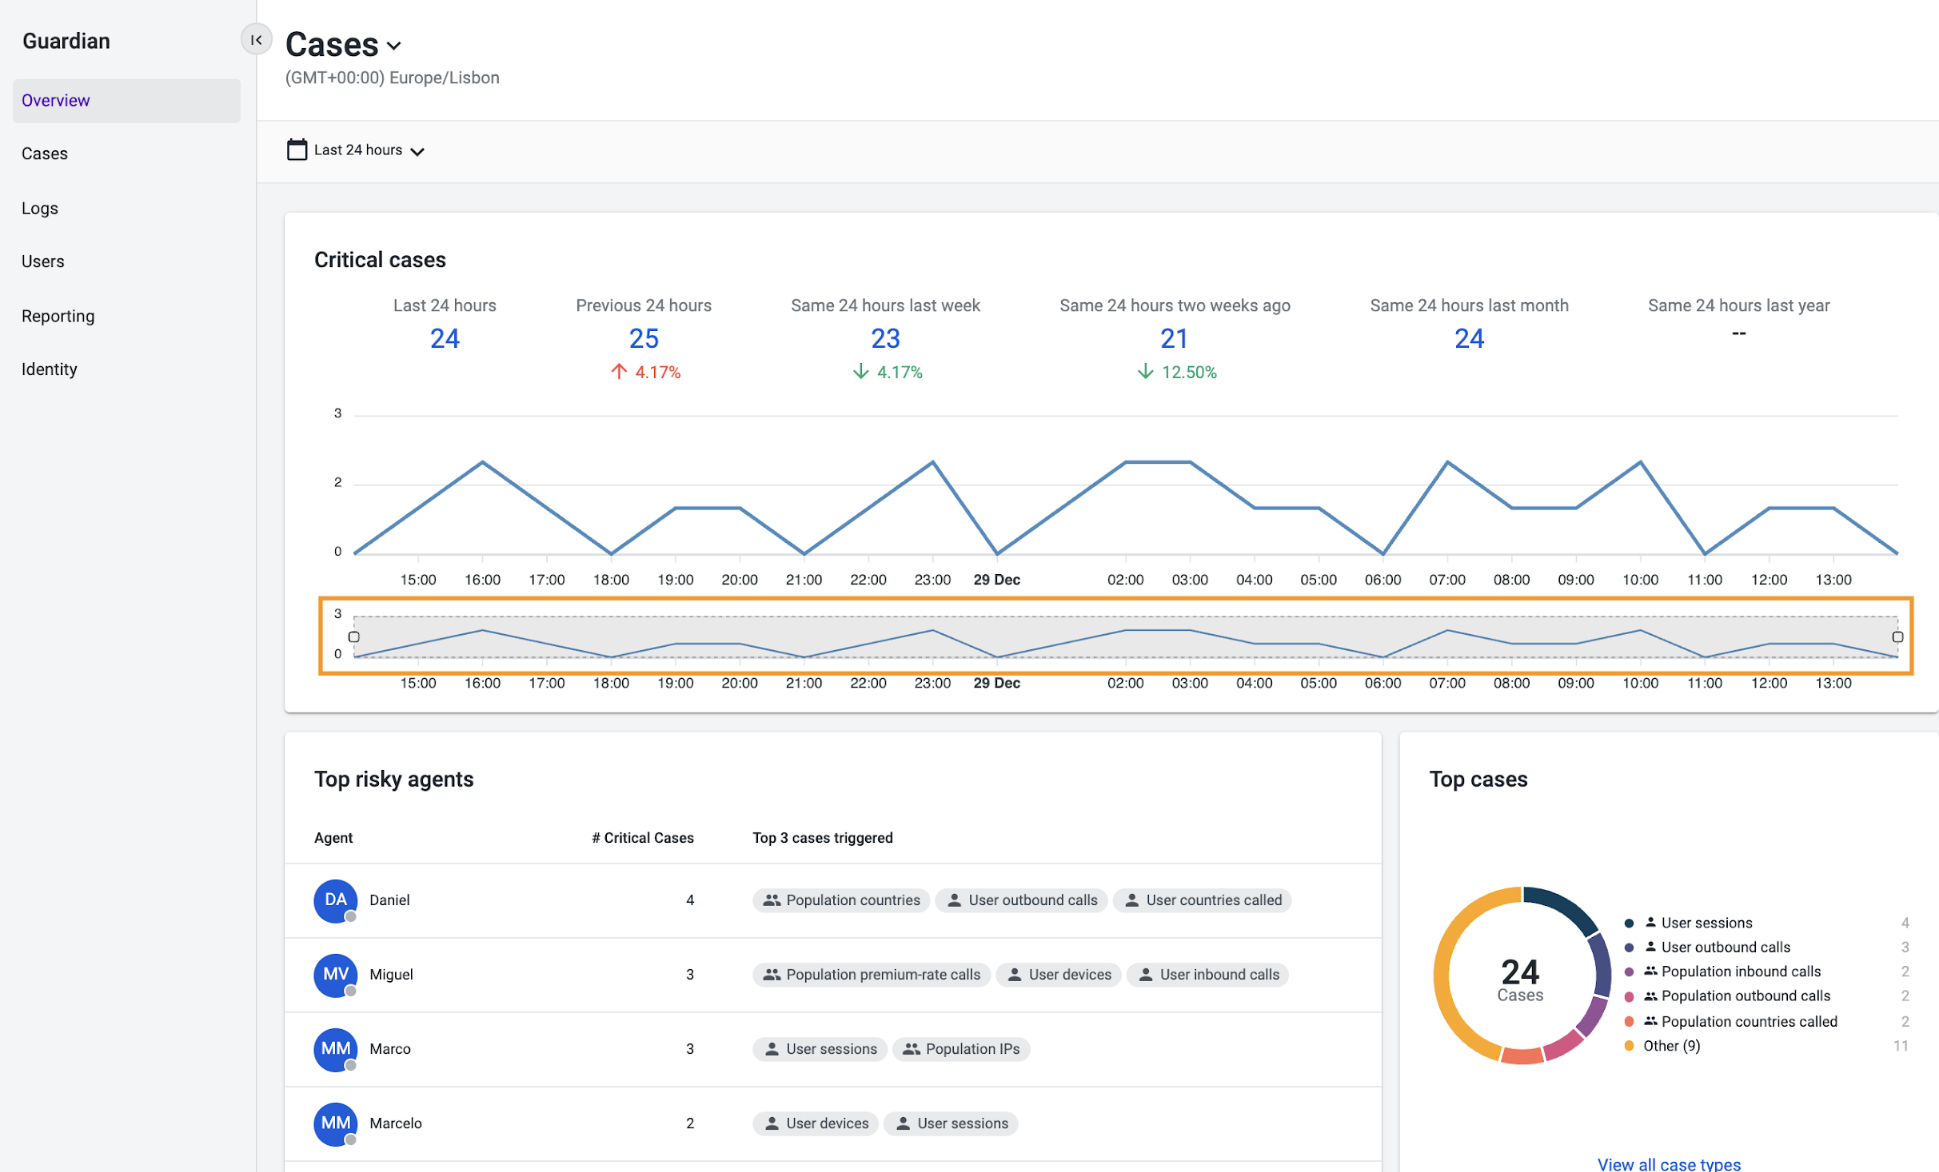
At the bottom of this section, you have another bar. It allows you to zoom in and out the chosen time on the filters. To do that, you just need to hold-click and drag the handle.
Top risky agents
As an admin, you can use this widget to identify the riskier agents working on your project. You can also use it to find other details.
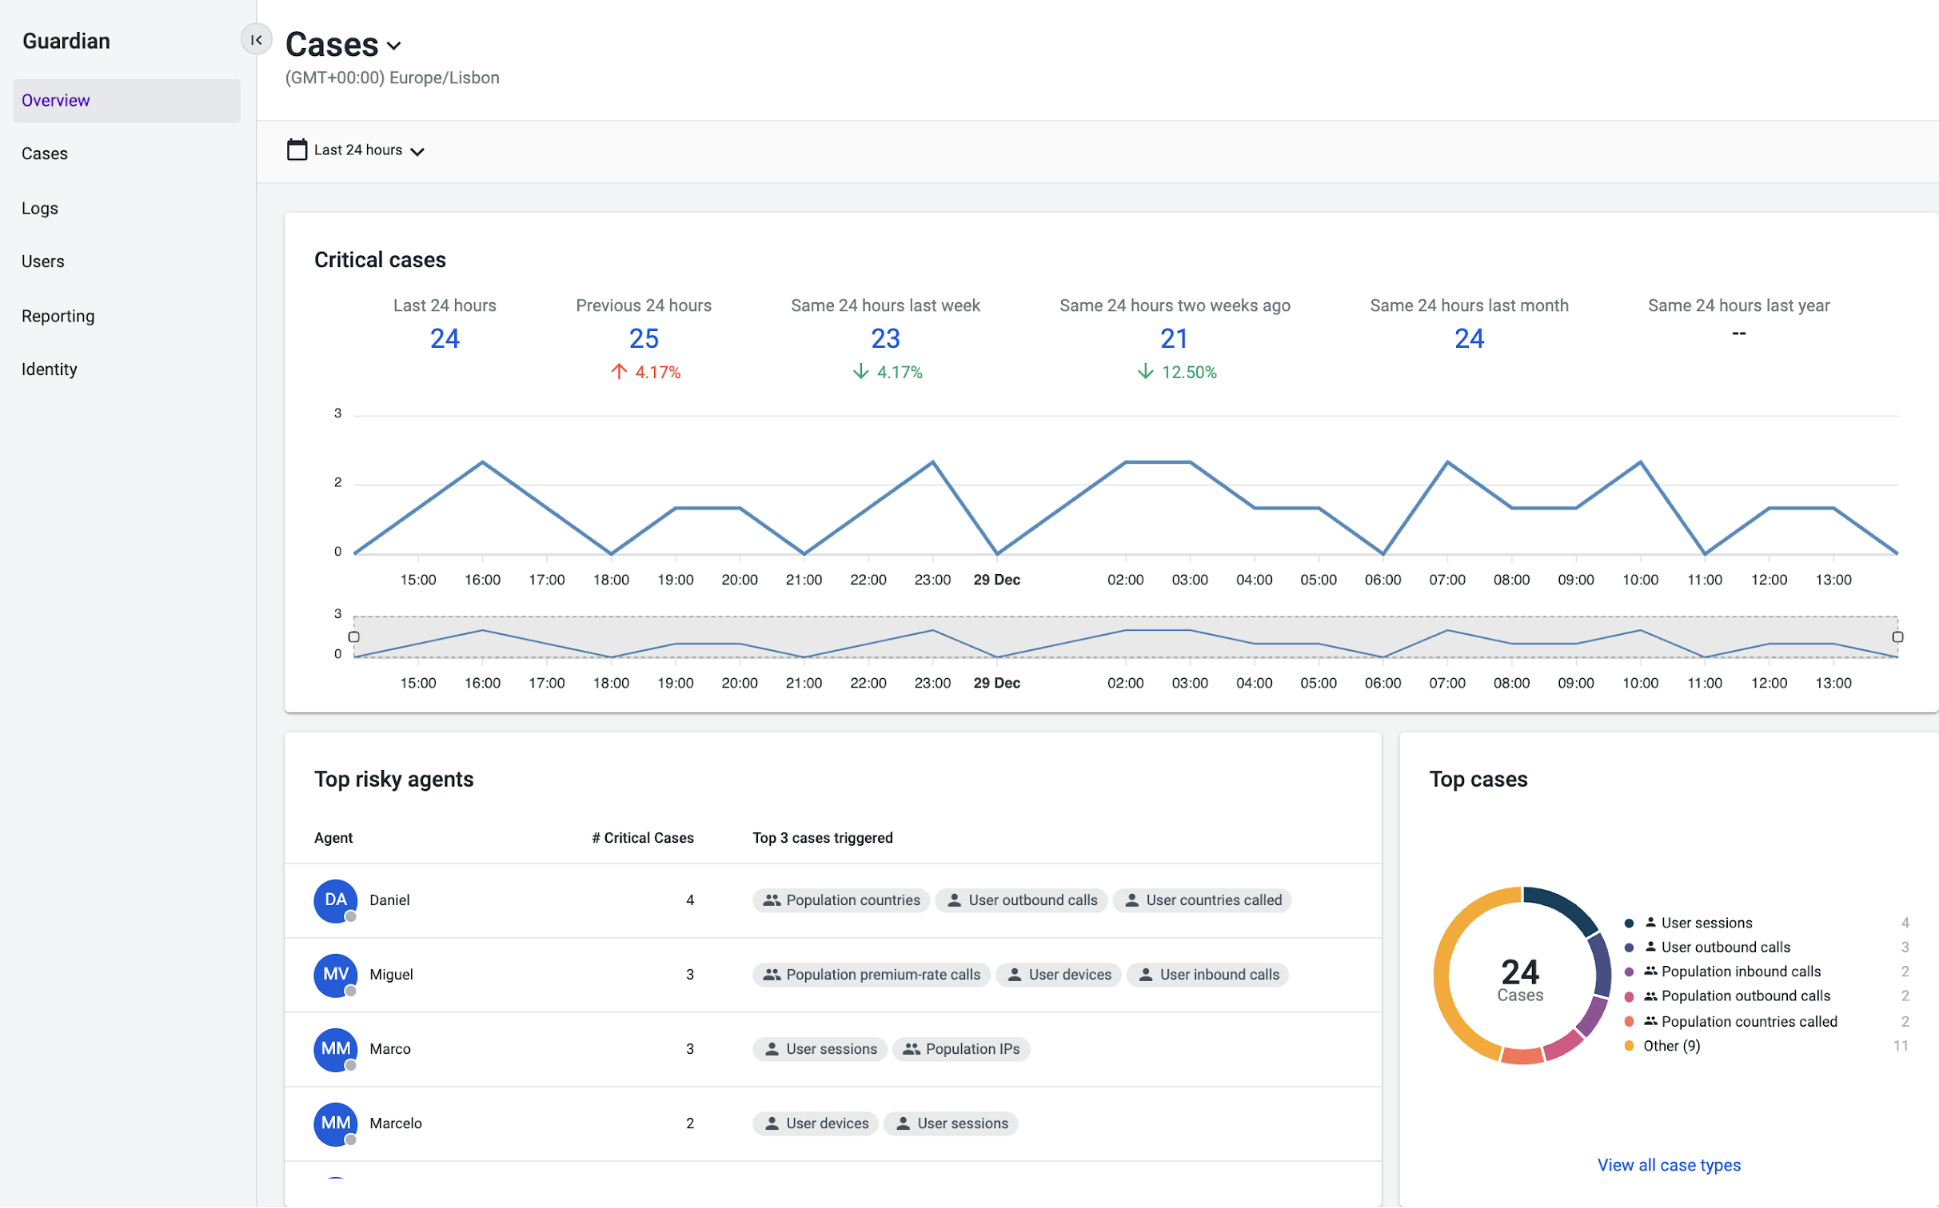
You can see the number of “Critical Cases” each agent had and the “Top 3 cases triggered”. Clicking on it will display more specific information, on the right side of the screen.
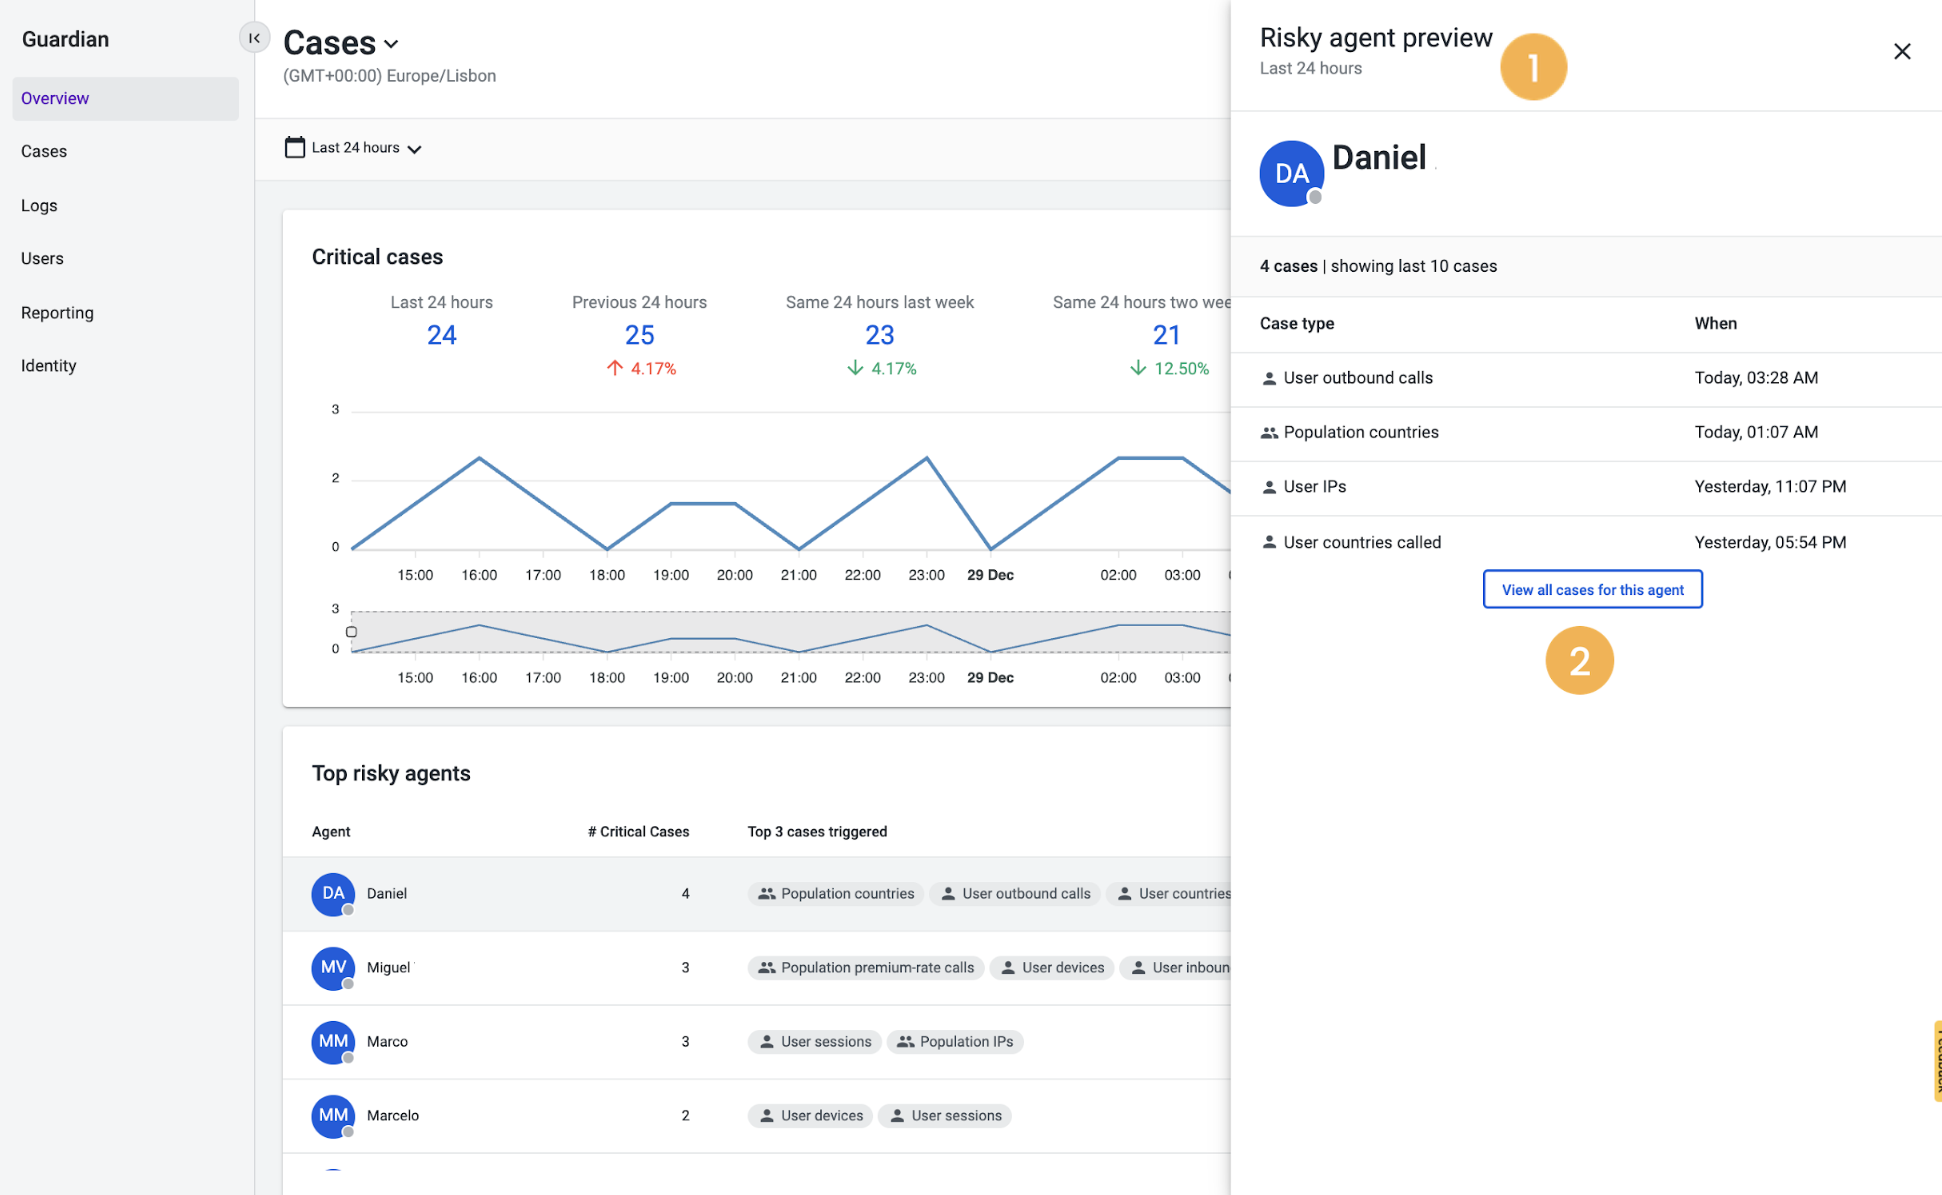
On the “Risky agent preview” [1], you’ll find the complete list of cases, arranged by date. You can access the complete case list for that agent. Just hit View all cases for this agent [2].
Top critical cases
On this graphical representation, you can easily recognize the different types of cases separated by color.
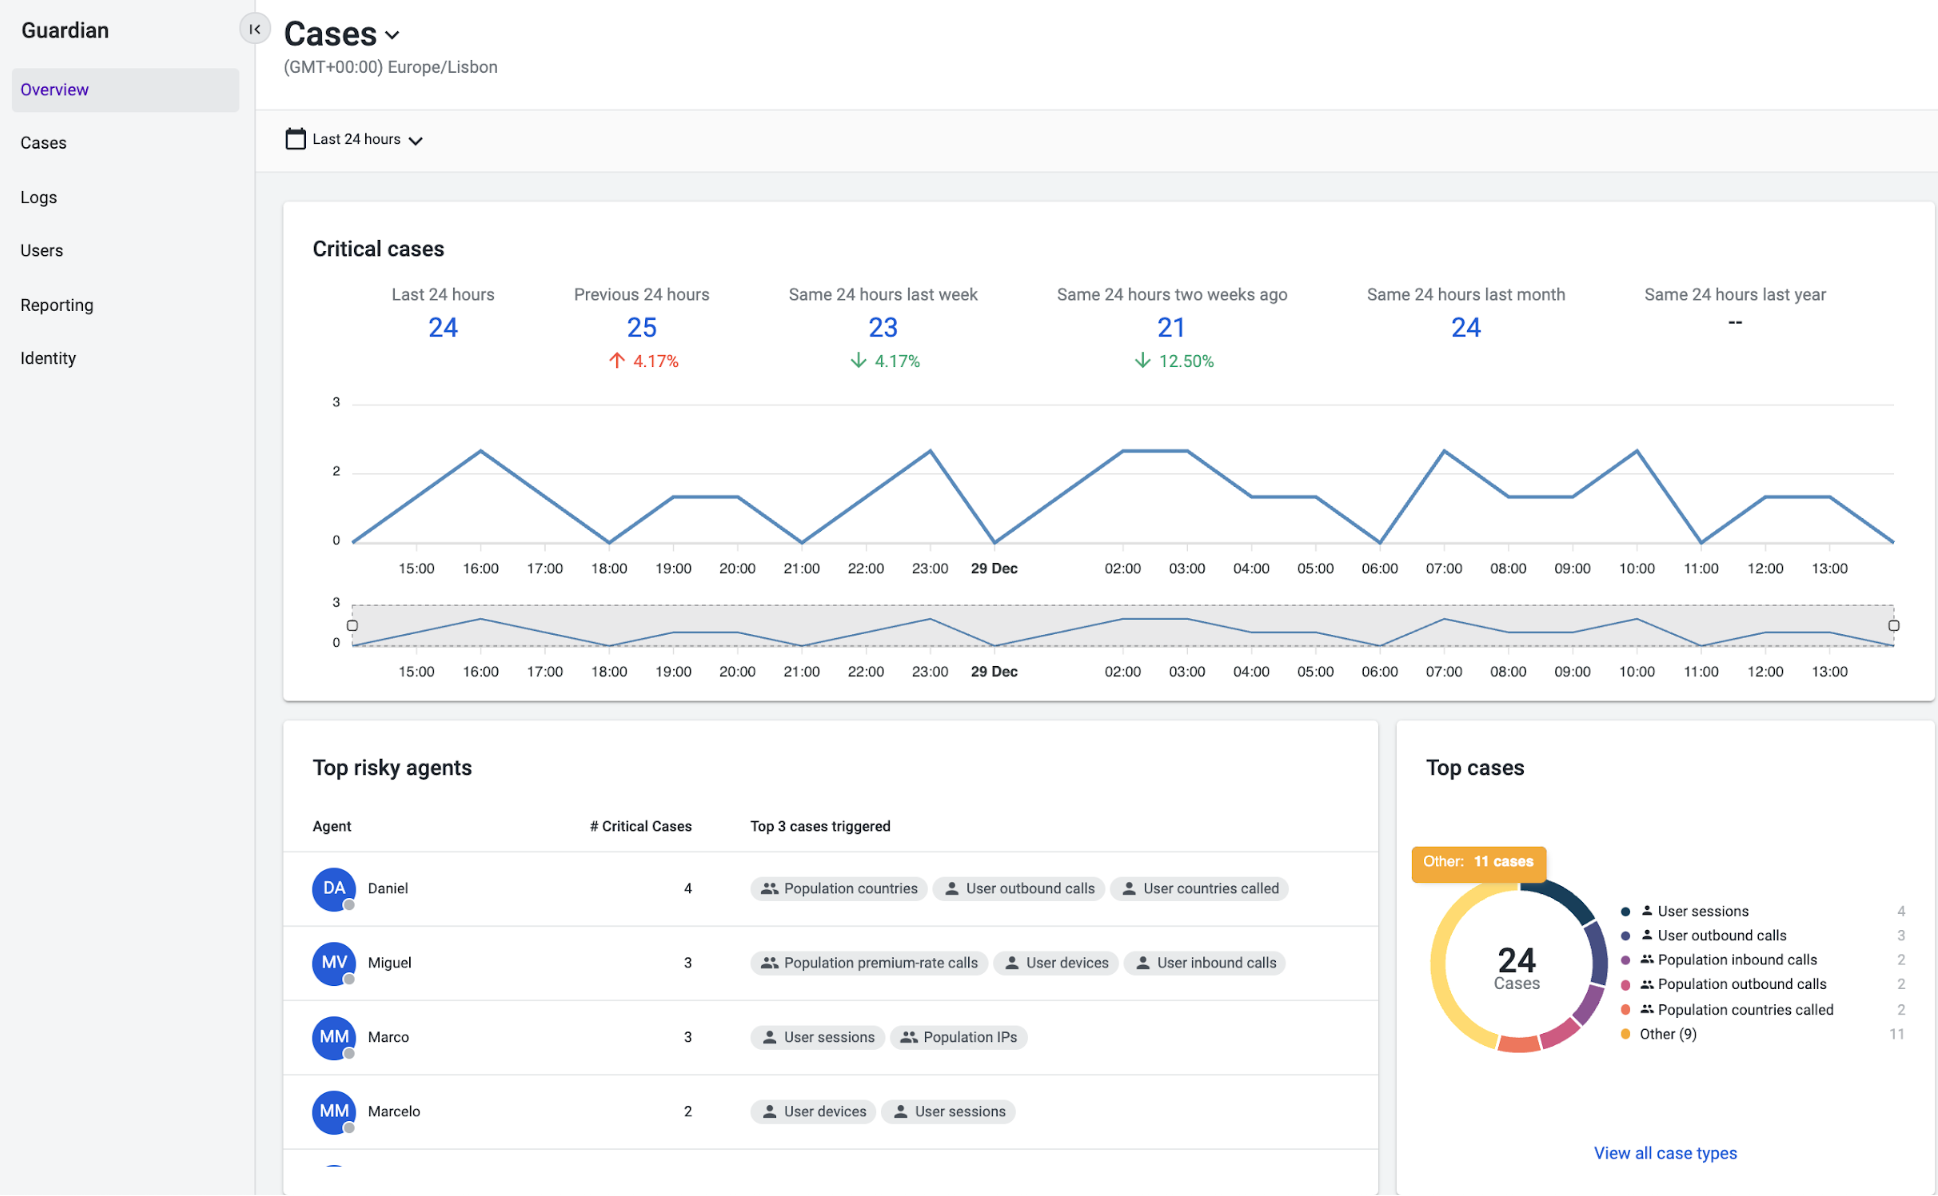
If you hover your cursor over the graph, you will get the number of cases for each type, also available in the list next to the graph.
User and sessions
If you select the Users and session overview option, on the drop-down menu, you’ll see the following:
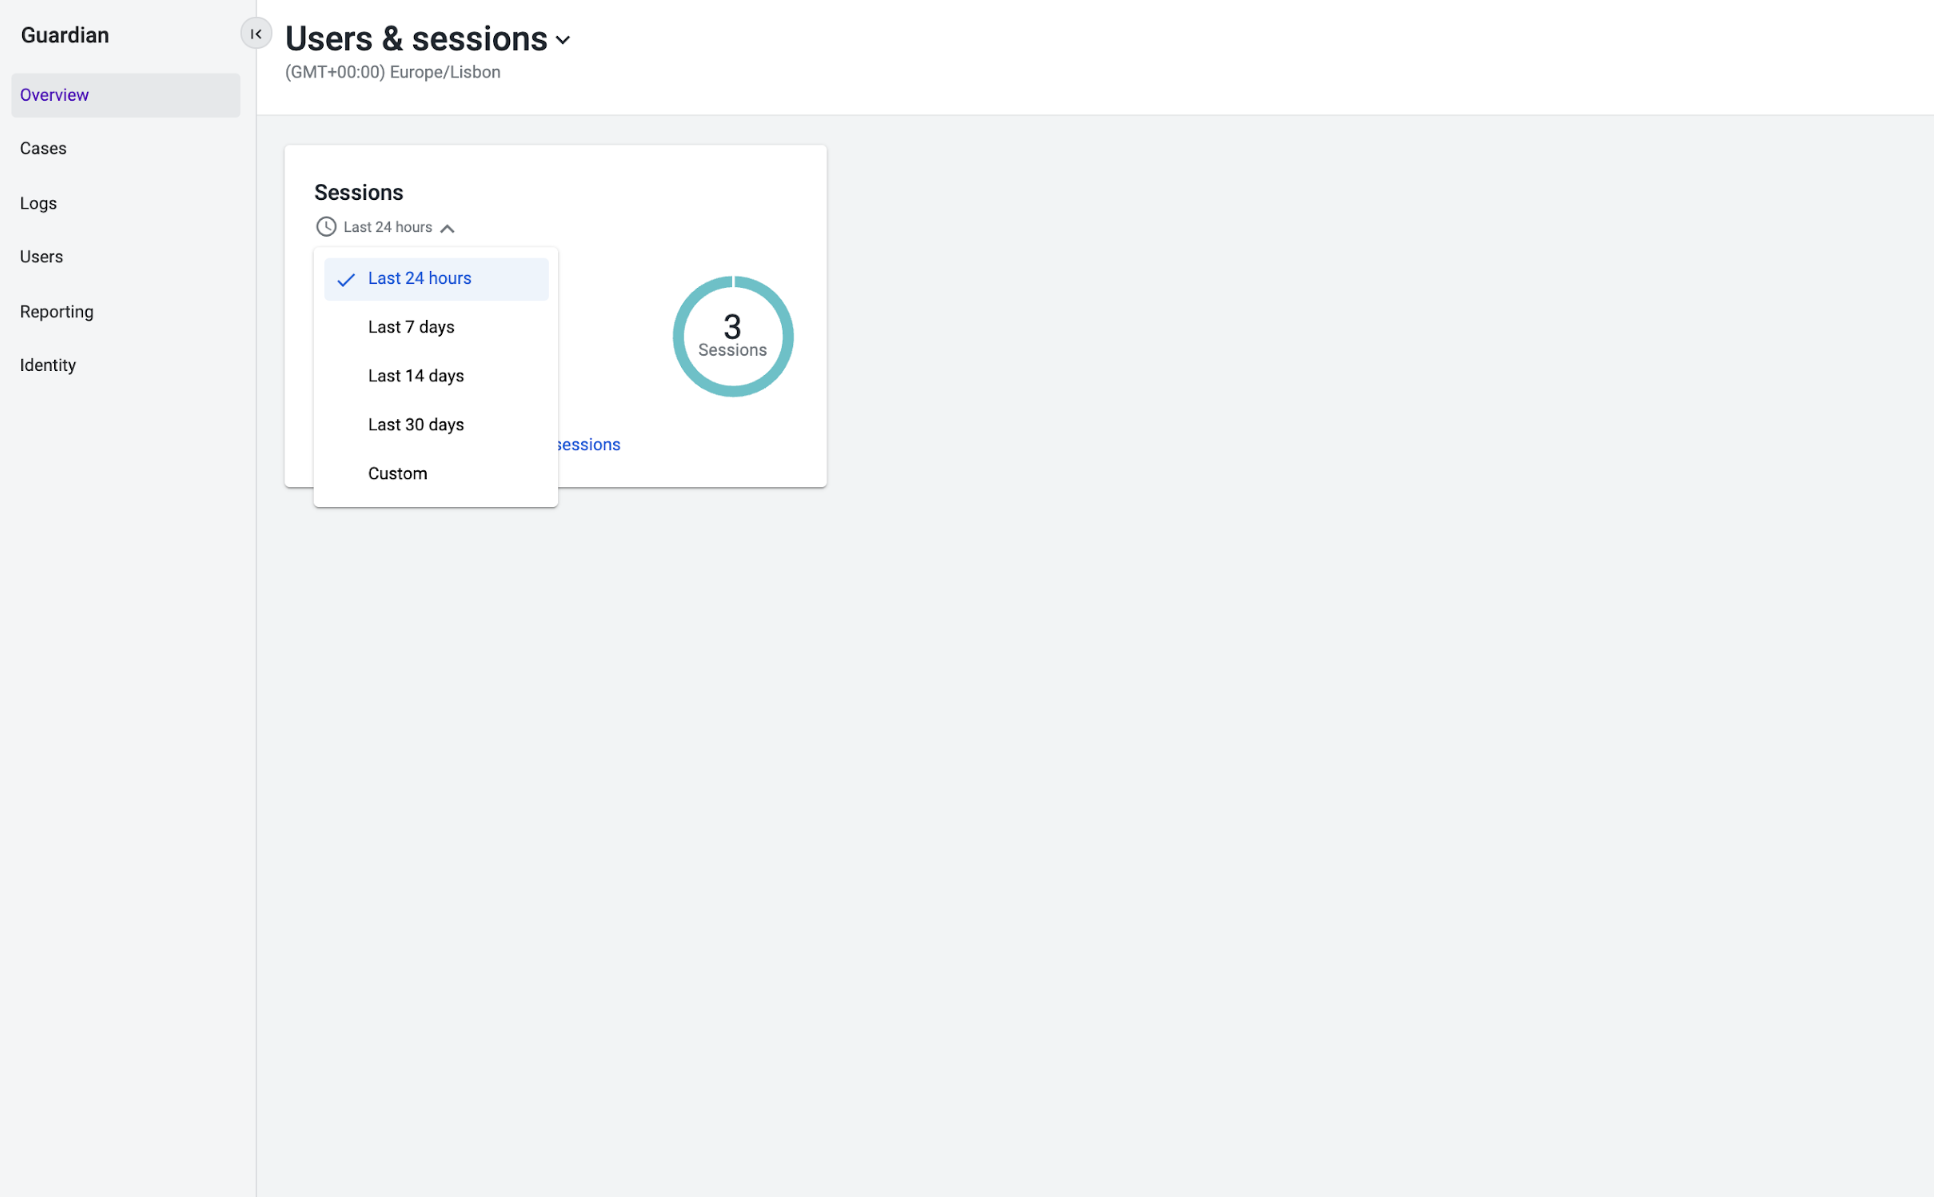
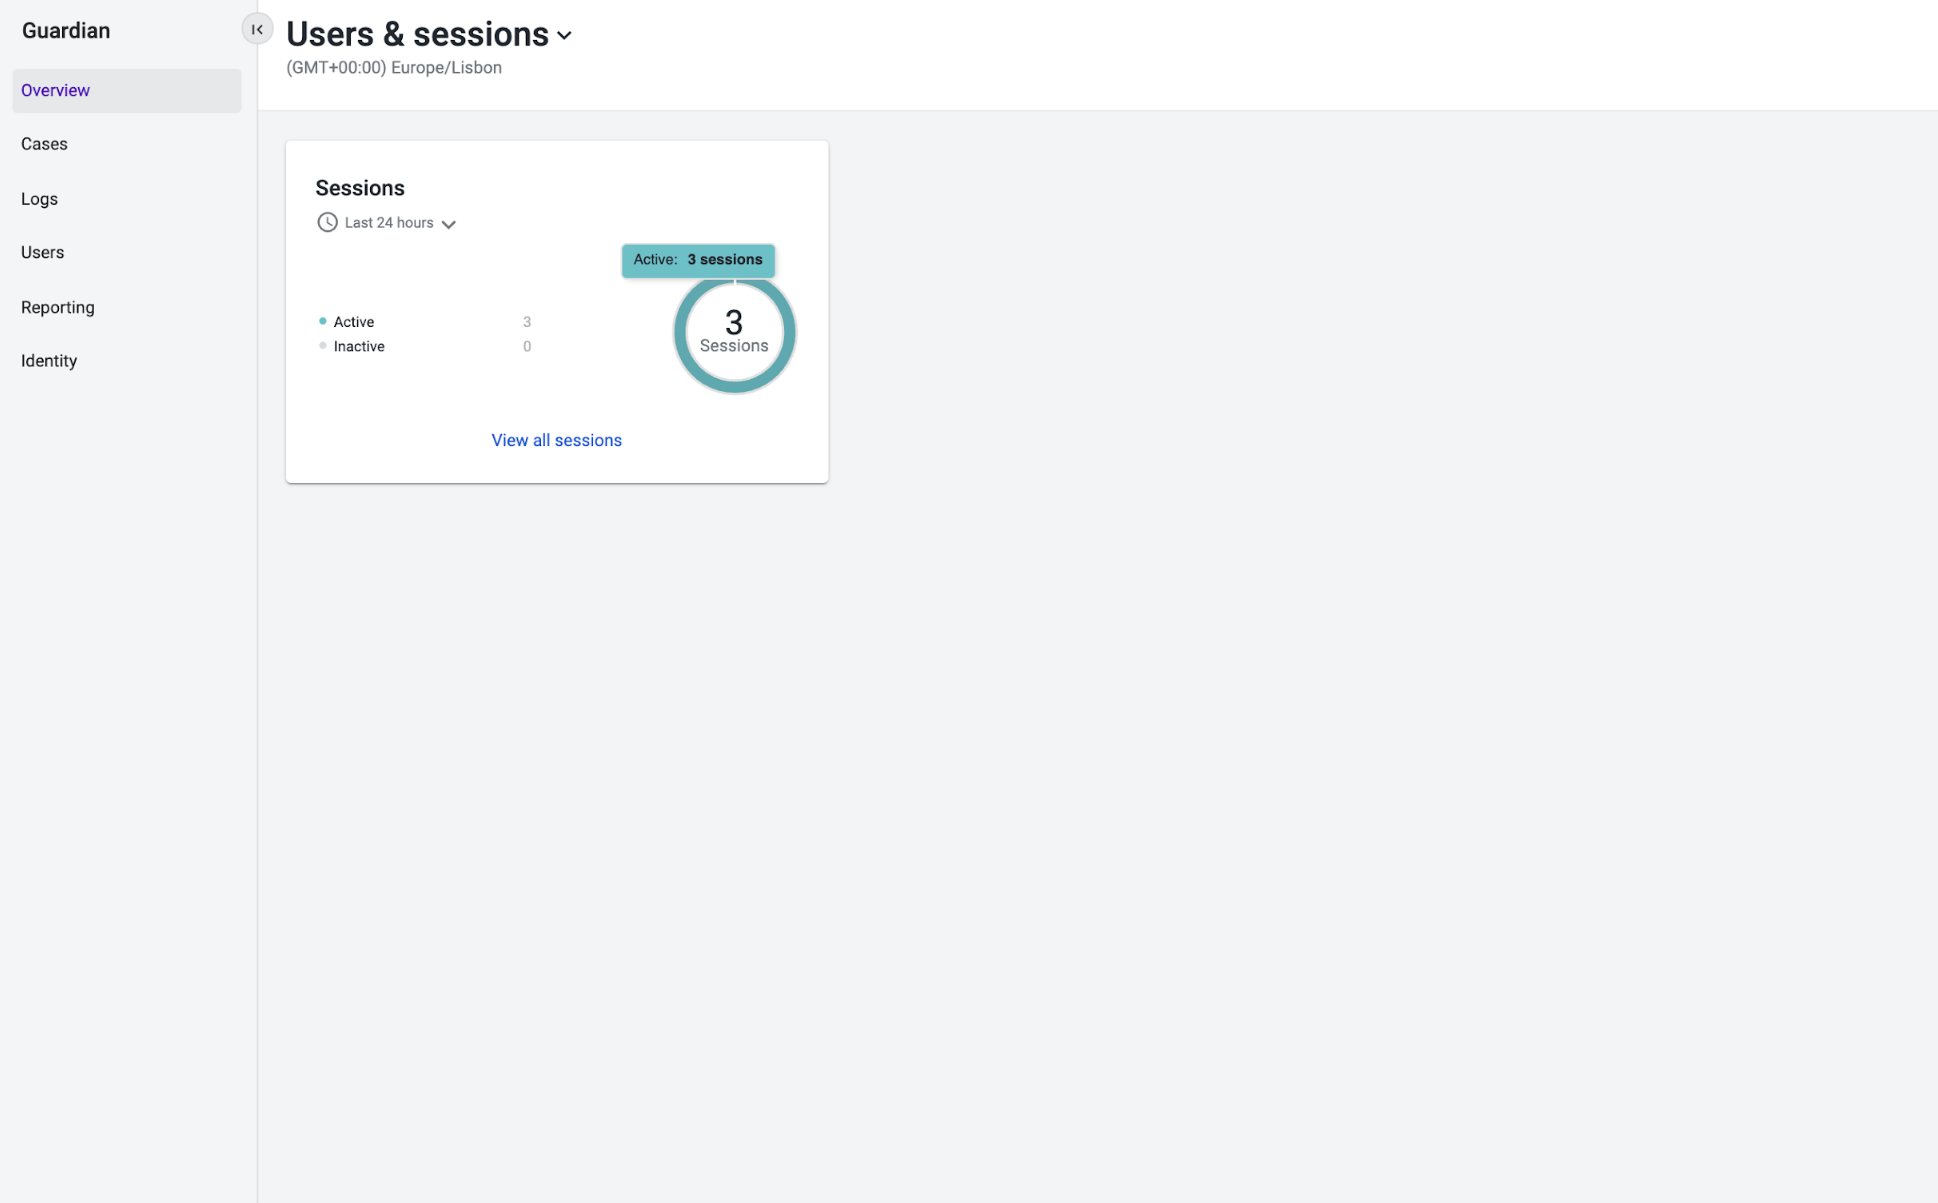
The new page will display an overview of the active and inactive sessions in the last 24 hours.
Tip: You can select a different time period.
If you select View all sessions, you will be instantly redirected to the "Logs" page. If you hover your cursor over the graph, you will get the number of active or inactive sessions, also available in the list next to the graph.